School inspection data summary report (IDSR) guide
This guide gives an overview of the inspection data summary report (IDSR) for primary and secondary schools, along with information to help interpret the charts.
Applies to England
School inspection data summary report (IDSR) guide
Overview of the Ofsted IDSR:
This guide is for primary and secondary schools including those with a sixth form.
The Ofsted IDSR is now a web-based page showing data for Ofsted inspectors to use when preparing for and during inspection. The IDSR is designed to align with our school inspection handbook, so that areas of interest can be used to identify inspection trails.
The IDSR can contain sensitive information about schools and colleges. It is your responsibility to ensure that the IDSR is stored and shared appropriately. Please see our IDSR conditions of use and storage statement.
Performance data for 2022 should not be directly compared with 2019 and earlier. Comparisons should not be made between schools. This is because schools may have been affected differently by COVID-19. Historic performance data from 2019 and earlier indicates the school context before the pandemic. For 2022, the IDSR quintiles have been removed.
Responding to feedback, we have now introduced a button at the top of the IDSR that allows users to remove grey sentence content from the report. These grey sentences show that the area has been reviewed, but there is nothing significant to highlight.
The box to hide grey text is located at the very top of the report with the following text: ‘Select to show only sentences for areas which are significant or exceptional’. Underneath this text is a user defined box that you can select or deselect.
Once the box is ticked, the report will only display those sentences where something significant has been highlighted, for example, progress was significantly below national and in bottom 20%. You can deselect the box to bring the grey sentences back.
Access your school’s Ofsted IDSR
As a web page via our new website
You can access it directly through our new Ofsted IDSR service or from the DfE’s Analyse School Performance (ASP) service. You will need a DfE Sign-in account and associated permissions for the school(s). We recommend that users with more than one school use our direct link.
Download and use offline
If you want to use the IDSR offline you have several options.
Option 1 – click the ‘download this page’ button located at the top of the web page. This will download the HTML page automatically to your downloads folder. You do not need an internet connection to view and share it.
Option 2 – click the ‘print this page’ button. This will take you to the print configuration page where you can print as a hard copy document.
Option 3 – click the ‘print this page’ button. This will take you to the print configuration page where under printer you can select ‘save as pdf’. This will convert the page into a PDF which can then be saved and shared. (Please note that this is reliant on you having the correct up to date software. Older versions may not support this functionality.)
Ofsted IDSR 2022
As outlined in the school inspection handbook, inspectors will gather evidence of the impact of the quality of education from various sources. This includes nationally generated performance information about pupils’ progress and attainment. The IDSR can only provide a starting point, however. Inspectors want to see first-hand the quality of education as experienced by pupils and understand how well leaders know what it is like to be a pupil at the school.
Supporting data tables used for the 2022 IDSR show national figures and quintile boundaries used to determine whether areas of interest sentences are triggered. To determine the quintile, the data for each school is percentile ranked from 1 to 100. If the score is in percentile 1 then this is the highest rank. If the score is in percentile 100 then this is the lowest rank. These ranks are then grouped into 5 quintiles. Ranks 1-20 are in quintile 1, ranks 21-40 are in quintile 2 and so on. The quintile boundaries document shows which scores fall within each quintile.
The areas of interest sentence master list details all the sentences that are possible to have on the areas of interest pages of the 2022 IDSR.
The Ofsted IDSR has been designed to:
-
reduce the time spent preparing for an inspection
-
provide interpretation of the data for inspectors
-
minimise the focus on small groups that distract the conversation away from meeting the needs of all pupils
The IDSR continues to contain areas of interest sentences to highlight important data trends and differences from national data.
Where applicable, the Ofsted IDSR contains:
-
Areas of interest
-
Subject attainment and progress at key stage 4 and 5 – based on 2022, 2019, 2018 and 2017 data
-
Progress at key stage 4 – based on 2022, 2019, 2018 and 2017 data
-
Attainment at key stage 4 – based on 2022, 2019, 2018 and 2017 data
-
English & mathematics re-sits – based on 2019 data
-
Reading attainment and progress at key stage 2 – based on 2022, 2019, 2018 and 2017 data
-
Writing attainment and progress at key stage 2 – based on 2022, 2019, 2018 and 2017 data
-
Mathematics attainment and progress at key stage 2 – based on 2022, 2019, 2018 and 2017 data
-
Other attainment measures at key stage 2 – based on 2022, 2019, 2018 and 2017 data
-
Pupil movement – based on movement between Jan 2020 and Jan 2021 census, Jan 2019 and Jan 2020 census and Jan 2018 and Jan 2019 census
-
Absence – based on 2021/22, summer 2021, autumn 2020 and earlier data (up to key stage 4)
-
Suspensions and permanent exclusions - based on 2020/21, 2019/20 and 2018/19 data (all key stages)
-
Key stage 5 qualification types and retention – based on 2022, 2019 and 2018 data
-
Destinations - based on 2019/20, 2018/19 and 2017/18
-
Pupil groups – based on 2022 (all key stages) and
2018/192021/22 (absence) data -
School and local context – based on 2022, 2021, 2020 and 2019 data
-
Year group context – based on 2022 data
-
Progress and attainment charts - based on 2022, 2019, 2018 and 2017 data
-
Subject entries at key stage 4 and 5 – based on 2022, 2021 and 2019 data
The sixth form sections of the IDSR includes 2022 provisional Department for Education (DfE) school and college attainment data. The destinations measures have now been updated with the revised data for destinations of students in the academic year 2020 to 2021, which was released by the DfE in October 2022. Value added data was not available for 2022.
Predecessor or successor link
If applicable, the Ofsted IDSR service will provide a link to a predecessor or successor provider to view. Some providers with a predecessor will not have a link. This is because it was decided to not include predecessors where there was no data on the predecessor school.
School details
The school details information at the beginning of the report comes from the DfE’s ‘Get information about schools (GIAS)’ service. This data is correct as of the release date on the IDSR.
Report information
The Ofsted IDSR will always show which release of performance data the report is based on. It will also show the date that the report was last released.
For example:
Release information: Provisional 2022 Phonics, Provisional 2022 KS1, -Provisional 2022 KS2, Revised 2019 KS4, Revised 2019 KS5
Release date: 20 October 2022
Areas of interest
The areas of interest in the IDSR are sentences providing inspectors with interpretation of a school’s historical data. Due to COVID-19 and the impact it has had on schools, the way we present the latest performance data (2022) has changed. The 2022 data will be presented in isolation and should not be directly compared to previous years. This is because schools may have been affected differently by COVID-19.
Historic performance data from 2019 and earlier indicates the school context before the pandemic. For 2022, the IDSR quintiles have been removed.
For the historic performance data a sentence may be triggered by high or low performance, either across 3 years, the last 2 years or in the latest year. Similarly, we generate sentences for absences and exclusions when data is particularly high or low. Some sentences describe the data, such as those relating to the reasons for permanent exclusions.
Please note: areas of interest sentences are shown in grey and italicised (not triggered) when there is not something significant to note, the criteria have not been met for a minimum of the latest year, or data relates to a small cohort. For progress and attainment, this is confirmed on the ‘Progress and attainment trend’ section of the IDSR. The school’s data is either in the highest 20% and significantly above national or the lowest 20% and significantly below national (for at least the latest year) to trigger a sentence which is not grey. These grey sentences are included to show inspectors that the data has been analysed, but is not an area of interest. At the top of the report you can select to show only sentences for areas which are significant or exceptional.
Example sentence
For the whole school, there is nothing significant or exceptional to highlight for total suspensions compared to either all schools or schools with a similar level of deprivation in 2020/21, therefore no conclusions can be drawn from this data.
As mentioned, sentences are not produced when the cohorts are very small, namely cohorts of 10 or fewer. Sentences about permanent exclusions will appear for every school, regardless of cohort size.
Schools are ranked against other state funded schools (excluding special schools) with a valid school level value. For some measures, ranking has not been possible because there are not enough distinct values across all schools to produce adequate ranks (1–100). For example, this may happen when looking at low prior attainment because there may be fewer values to rank for some measures.
Subjects
Subject entries at key stage 4 - 2022
These subject sentences relate to the entry into subjects in 2022. There may be some differences between 2022 entries and earlier years. For example, in 2022 early entries are not included in attainment data but are included in entries. In 2021, early entries were not included in the entries data either.
English Baccalaureate entry
This sentence describes the EBacc entry rate for 2022 based on published 2022 performance data.
Example sentence
The subjects of the EBacc form a strong academic foundation for the key stage 4 curriculum. The EBacc entry rate in this school in 2022 was 53%. The subject that appears to be the greatest barrier to more pupils studying the EBacc is languages (51%).
Subject attainment and progress at key stage 4 - 2019 and earlier
These sentences relate to attainment and entries into subjects in 2019 and earlier.
English Baccalaureate entry
The English Baccalaureate (EBacc) is a set of subjects at GCSE that keeps young people’s options open for further study and future careers. The EBacc requires pupils to have studied English language and literature, mathematics, science, geography or history, and a language. The DfE have published further guidance about the EBacc.
The EBacc entry data is calculated using early entry and discounting rules. This means that pupils who entered EBacc subjects in 2021 will have those entries counted towards their EBacc entry rate in 2022. However, the subject entries data only includes subjects entered in 2021.
A sentence is shown for every school where there were at least 11 pupils. This describes the EBacc entry rate for the school in 2022. Another sentence shows the subject cluster with the lowest rate of EBacc entry (if the entry rate is below 75%). This could be either English, mathematics, science, humanities or languages.
Example sentence
The subjects of the EBacc form a strong academic foundation for the key stage 4 curriculum. The EBacc entry rate in this school in 2022 was 41%. The subject that appears to be the greatest barrier to more pupils studying the EBacc is languages (47%).
EBacc subject level average point scores
Sentences describe the performance of the school in relation to other schools for each of the EBacc subjects. Subjects are based on the subject families in ‘Table 1’ above. A sentence will appear if the average point score for pupils in a particular subject is in the highest or lowest 20% of all schools and only if entry levels were at or above national entries. Subjects are listed when there are multiples. The average point score is shown in brackets.
Example sentence
For the following EBacc subject(s), the average point score was in the highest 20% and the proportion of entries was at or above the national average: double science (4.9).
Non-EBacc subject level average point scores
Sentences describe the performance of the school compared to other schools for each of the subjects outside of the EBacc. Subjects are based on the subject families in ‘Table 1’ above. A sentence will appear if the average point score for pupils in a particular subject is in the highest or lowest 20% of all schools and only if entry levels were at or above national entries. Subjects are listed when there are multiples. The average point score is shown in brackets.
Example sentence
For the following subject(s) outside of the EBacc, the average point score was in the lowest 20% and the proportion of entries was at or above the national average: engineering (3.3).
EBacc value added
Value added is a measure of progress, like Progress 8. This means that pupils’ results are compared to the progress of other pupils nationally with similar starting points. EBacc value added measures are calculated for science, languages and humanities. This sentence will show whether there is high or low performance in value added in the latest year or across time. High or low performance is measured using statistical significance tests and percentile rank.
Example sentence
Science value added (0.7) was significantly above national and in the highest 20% in 2022.
EBacc attainment of grade 4 or higher
EBacc attainment measures are calculated for science, languages and humanities. This sentence will show whether there is high or low attainment of grade 4 or above in the latest year or across time. High or low performance is measured using percentile rank.
Example sentence
The percentage achieving grade 4+ in science (82%) was in the highest 20% in 2022.
Subject progress at key stage 5 - 2022
There is no value added data available for all schools in 2022, therefore no measure can be presented in the IDSR.
Subject progress at key stage 5 - 2019 to 2017 (not directly comparable to 2022)
There can be multiple sentences if your provider fits the criteria of each sentence.
Each sentence outlined below will only appear if they have been triggered for your provider.
A sentence will be flagged when there is consistently significantly high or low progress in the same subject for the last 2 years, or when there is significantly low progress in the latest year based on statistical significance and percentile rank.
Example sentence
The value-added score for qualifications of A level size and above was significantly above the national average in both 2018 and 2019 for the following subjects: mathematics.
The Department for Education supply the source data for this section.
Progress
Progress at key stage 4 - 2022
There can be multiple sentences under each heading if your school fits the criteria of each sentence.
Low or high performance
This sentence will show when there is high or low performance in Progress 8 and its elements: English, mathematics, EBacc and open. High or low performance is measured using statistical significance tests and percentile rank. Sentences will be triggered if the progress score for all pupils is in the highest or lowest quintile and the score is significantly different to the national score. This is based on the distribution of scores for all pupils when the cohort was greater than 10.
The progress score for the latest year is in brackets.
Example sentence
Overall Progress 8 (0.8) was significantly above national and in the highest 20% in 2022.
Progress at key stage 4 – 2019 to 2017 (not directly comparable to 2022)
There can be multiple sentences under each heading if your school fits the criteria of each sentence.
Low or high performance
This sentence will show when there is high or low performance in Progress 8 and its elements: English, mathematics, EBacc and open. High or low performance is measured using statistical significance tests and percentile rank. Sentences will be triggered if the progress score for all pupils is in the highest or lowest quintile and the score is significantly different to the national score. The sentence will also identify a trend of high or low performance by checking the latest 3 years, 2 years, or the latest year. This is based on the distribution of scores for all pupils when the cohort was greater than 10 for each of the years.
The progress score for the latest year is in brackets.
Example sentence
Overall Progress 8 (0.8) was significantly above national and in the highest 20% in 2019 as well as in 2018 and 2017.
Service children’s education provider IDSRs do not incorporate 2017 data, so sentences are based on the latest 2 years, or the latest year.
Key stage 4: Progress 8 trend analysis
A sentence shows when there has been a fall or increase in Progress 8 score. This sentence will flag when there was a drop or increase between 2017 and 2018, or 2018 and 2019. This will align with arrows shown on the progress trend charts.
Progress is a relative measure, and the national average will always be very close to 0. Progress scores are not directly comparable year on year as they do not compare the cohorts with each other. For example, if all the pupils in 2019 generally made more progress than those in 2018, a comparison of progress scores would not show this improvement.
To allow for direct comparisons, every progress score is standardised using the formula shown in the ‘Understanding the data in the IDSR’ section. A sentence will appear if the standardised score has changed by more than 0.5 (half a grade) and the quintile position has changed by more than 1 quintile. This is referred to as markedly higher or lower in the legend of the progress and attainment trend chart. Note that this is not based on statistical significance testing.
Example sentence
English Progress 8 has improved between 2018 and 2019.
Service children’s education provider IDSRs do not incorporate 2017 data, so sentences based on only the latest 2 years, or the latest year are shown.
Progress at key stage 5 – 2022
Due to the COVID-19 pandemic it has not been possible to calculate progress measures for key stage 5 in 2022.
Progress at key stage 5 – 2019 to 2017 (not directly comparable to 2022)
There can be multiple sentences if your provider fits the criteria of each sentence.
Each sentence outlined below will only appear if they have ‘triggered’ for your provider.
A sentence will flag when there is consistently significant high or low progress in A level, AS level or applied general qualifications for the last 2 years, or when there is significantly higher or lower progress in the latest year based on statistical significance and percentile rank.
Example sentence
The value added score for AS level was significantly below national and in the lowest 20% in both 2018 and 2019.
Example sentence
In 2019 the value- added score was significantly below national and in the lowest 10% in A level and applied general.
Attainment
Attainment at key stage 4 - 2022
A sentence will flag when there is high or low attainment of overall Attainment 8 and each of the Attainment 8 elements: English, mathematics, EBacc and open. The sentence will appear for the latest year only, based on percentile rank and significance. The score for each of the measures flagged will appear in brackets.
Example sentence
Overall Attainment 8 (37) was significantly below national and in the lowest 20% in 2022.
Attainment at key stage 4 – 2019 to 2017 (not directly comparable to 2022)
A sentence will flag when there is high or low attainment of overall Attainment 8 and each of the Attainment 8 elements: English, mathematics, EBacc and open. The sentence will appear for the latest 3 years, 2 years or the latest year, based on percentile rank. The score for each of the measures flagged will appear for the latest year in brackets.
Example sentence
Overall Attainment 8 (37) was in the lowest 20% in 2019 as well as in 2018.
Service children’s education provider IDSRs do not incorporate 2017 data, so sentences based on only the latest 2 years or the latest year are shown.
Attainment at key stage 5 – 2022
This section includes sentences based on average point scores and the percentage attaining the AAB threshold.
A sentence will flag for a particular qualification type when the provider’s attainment score is significantly above or below national and in the highest or lowest 20% in 2022.
Best 3 A levels applies to the subset of A level students who entered at least one full size A level (this includes double award A levels, and applied A levels, but does not include AS levels, general studies or critical thinking). If students are entered for less than 3full3 full size A levels, they are only included in the measure if they have not entered for other academic, applied general and tech level qualifications greater than or equal to the size of an A level. Where a student has only been at a school or college for one year, they need to have entered 3 A levels to be included.
The Department for Education supply the source data for this section.
Example sentences
The average point score per entry in A level was significantly above national and in the highest 20% in 2022.
Example sentences
The percentage of students achieving at least AAB in 3 A levels (3%) was significantly below national and in the lowest 20% in 2022.
Example sentences
The completion and attainment score in technical certificate (L2) was in the highest 20% in both 2018 and 2019.
Attainment at key stage 5 – 2019 to 2017 (not directly comparable to 2022)
This section includes sentences based on average point scores and completion and attainment scores.
A sentence will flag for a particular qualification type when the provider’s attainment score is in the highest or lowest 20% in both 2018 and 2019. A sentence will also flag for a particular qualification type if the attainment score is in the highest or lowest 10% in the current year.
Best 3 A levels applies to the subset of A level students who entered at least one full size A level (this includes double award A levels, and applied A levels, but does not include AS levels, general studies or critical thinking). If students are entered for less than 3 full size A levels, they are only included in the measure if they have not entered for other academic, applied general and tech level qualifications greater than or equal to the size of an A level. Where a student has only been at a school or college for one year, they need to have entered 3 A levels to be included.
For completion and attainment sentences will flag when there is consistently high or low progress in tech level (L3) qualifications or technical certificates (L2).
The Department for Education supply the source data for this section.
Example sentences
The average point score per entry in A level was in the highest 20% in both 2018 and 2019.
Example sentences
The average point score per entry in A level was in the lowest 10% in 2019.
Example sentences
The completion and attainment score in technical certificate (L2) was in the highest 20% in both 2018 and 2019.
English and mathematics re-sits
If a sixth form has students that did not achieve a grade 4 in English or mathematics at key stage 4, then a sentence will appear to show this cohort number. A subsequent sentence will also appear to show how many of this cohort did a resit in this subject.
Two further sentences may appear regarding the proportion of students achieving a grade 4 or above and the percentage that improved their grade, if the cohort was greater than 10 and the proportion was significant when compared to the national value.
The improvement of grade is any improvement regardless of whether the student reached grade 4.
The Department for Education supply the source data for this section.
Progress: reading, writing and mathematics
Under each subject heading, the IDSR groups sentences by key stage where applicable.
There can be multiple sentences under each heading if your school fits the criteria of each sentence.
Progress at key stage 2
For primary schools, the only progress measure available measures progress from key stage 1 to key stage 2.
Low or high performance - 2022
These sentences show when there is high or low performance for progress in reading, writing or mathematics, based on statistical significance tests and percentile rank. Sentences will flag if the progress score for all pupils is in the highest or lowest quintile for 2022, and the score is significantly different to the national score. This is based on the distribution of scores for all pupils and when cohorts were more than 10 for each of the years. The progress score for the latest year is in brackets.
Example sentences
Key stage 2 progress in reading (-5.1) was significantly below national and in the lowest 20% in 2022.
Low or high performance – 2019 to 2017
These sentences show when there is high or low performance for progress in reading, writing or mathematics, based on statistical significance tests and percentile rank. Sentences will flag if the progress score for all pupils is in the highest or lowest quintile for the latest 3 years, 2 years or the latest year and if the score is significantly different to the national score. This is based on the distribution of scores for all pupils and when cohorts were more than 10 for each of the years. The progress score for the latest year is in brackets. If the latest 3 years sentence is not flagged, a sentence will appear if the all pupil group is in the highest or lowest quintile for the latest 2 years.
Example sentences
Key stage 2 progress in reading (-5.1) was significantly below national and in the lowest 20% in 2017, 2018 and 2019.
Key stage 2 progress in reading (-4.9) was significantly below national and in the lowest 20% in 2019 as well as in 2018.
Key stage 2 progress in reading (-5.4) was significantly below national and in the lowest 20% in 2019.
Service children’s education provider IDSRs do not incorporate 2017 data so sentences based on only the latest 2 years, or the latest year are shown.
Progress trend analysis – 2019 to 2017
A sentence shows when there has been an increase or decrease in progress score between 2017 and 2018, or 2018 and 2019. This will align with arrows shown on the progress trend charts.
Progress is a relative measure, and the national average will always be very close to 0. Progress scores are not directly comparable year on year as they do not compare the cohorts with each other. For example, if all the pupils in 2019 generally made more progress than those in 2018, a comparison of progress scores would not show this improvement.
To allow for direct comparisons, every progress score is standardised using the formula shown in the ‘Understanding the data in the IDSR’ section. A sentence will appear if the standardised score has changed by more than 1 and the quintile position has changed by more than 1.
Example sentence
Reading progress has improved between 2018 and 2019.
Attainment: reading, writing and mathematics
The following guidance is applicable to primary schools only.
There can be multiple sentences under each heading if your school fits the criteria of each sentence.
Attainment at key stage 2 – 2022
A sentence will flag when there is high or low attainment of the expected standard for each subject for 2022, based on statistical significance and percentile rank. It will also flag the number of pupils who did not meet the expected standard, where there are more than 10 pupils not meeting the expected standard and who have a scaled score, the average scaled score of those pupils.
In 2022 there were unexpected difficulties during the collection and processing of key stage 2 assessment data. As a result, there are larger volumes of missing data than in previous years. The IDSR will indicate where the school had missing test or teacher assessment results which affected the provisional data. A sentence will note when the school was contacted by the Standards and Testing Agency. The IDSR will also highlight where missing results were identified in the pupil data in the relevant section, for example missing reading test data will be shown in the ‘Reading’ section. It is possible that the school had pupils with missing test data, but the pupils did not get highlighted as having missing data in the provisional dataset. In these cases, the pupil had enough marks on other test papers to meet the expected standard.
Example sentence
Key stage 2 attainment of the expected standard (100+) in mathematics (39%) was significantly below national and in the lowest 20% in 2022. Of the 38 pupils in 2019, 23 did not meet the expected standard. 19 of these pupils had a score, with an average scaled score of 84.
A different sentence will appear when there is significant high or low attainment of the high standard in reading or mathematics. A sentence will also show when there is significant high or low attainment of greater depth in writing.
Example sentence
Key stage 2 attainment of the high standard (110+) in reading (2%) was significantly below national and in the lowest 20% in 2022.
If both the expected standard and high/greater depth sentence flag for both high or low attainment for the same subject, the sentence will be combined.
Attainment at key stage 2 – 2019 to 2017
A sentence will flag when there is high or low attainment of the expected standard for each subject for the latest 3 years, 2 years or the latest year, based on statistical significance and percentile rank. It will also flag the number of pupils who did not meet the expected standard in the latest year and, where there are more than 10 pupils not meeting the expected standard and who have a scaled score, the average scaled score of those pupils.
Example sentence
Key stage 2 attainment of the expected standard (100+) in mathematics (39%) was significantly below national and in the lowest 20% in 2019 as well as in 2018 and 2017. Of the 38 pupils in 2019, 23 did not meet the expected standard. 19 of these pupils had a score, with an average scaled score of 84.
A different sentence will appear when there is significant high or low attainment of the high standard in reading or mathematics. A sentence will also show when there is significant high or low attainment of greater depth in writing.
Example sentence
Key stage 2 attainment of the high standard (110+) in reading (2%) was significantly below national in the lowest 20% of all schools in 2019, as well as in 2018 and 2017.
If both the expected standard and high/greater depth sentence flag for both high or low attainment for the same subject, the sentence will be combined.
Service children’s education provider IDSRs do not incorporate 2017 data so sentences based on only the latest 2 years, or the latest year are shown.
A sentence will appear for reading and mathematics when the 3-year combined average key stage 2 attainment score was in the highest or lowest 20% of all schools.
Example sentence
The 3-year average reading attainment score (102.1) was in the lowest 20%.
Service children’s education provider IDSRs do not incorporate 2017 data so no sentence for 3-year average will be displayed.
Attainment at key stage 1 – 2022
A sentence will flag when there is significant high or low attainment of the expected standard for each subject for 2022, based on statistical significance and percentile rank. Due to the distribution of the data, it was not possible to calculate the highest and lowest 20% for the key stage 1 writing greater depth measure in 2022. As such this sentence is based on statistical significance alone.
Example sentence
Key stage 1 attainment of the expected standard (30%) in reading was significantly below national and in the lowest 20% in 2022.
A different sentence will flag if there is low attainment of greater depth for each subject.
Example sentence
Key stage 1 attainment of greater depth (3%) in reading was significantly below national and in the lowest 20% in 2022.
If both the expected standard and greater depth sentence flag for both significant high or low attainment for the same subject, the sentence will be combined.
Attainment at key stage 1 – 2019 to 2017
A sentence will flag when there is significant high or low attainment of the expected standard for each subject for the latest 3 years, 2 years or the latest year, based on statistical significance and percentile rank.
Example sentence
Key stage 1 attainment of the expected standard (30%) in reading was significantly below national and in the lowest 20% in 2019, as well as in 2018 and 2017.
A different sentence will flag if there is low attainment of greater depth for each subject.
Example sentence
Key stage 1 attainment of greater depth (3%) in reading was significantly below national and in the lowest 20% in 2019, as well as in 2018 and 2017.
If both the expected standard and greater depth sentence flag for both significant high or low attainment for the same subject, the sentence will be combined.
Service children’s education provider IDSRs do not incorporate 2017 data so sentences based on only the latest 2 years, or the latest year are shown.
Attainment in phonics – 2022
A sentence for phonics will only appear under the reading subject section and will flag when there is significant high or low attainment of the expected standard for 2022, based on statistical significance and percentile rank. If the sentence has been triggered due to the school being below national and in the lowest 20%, an additional sentence will be displayed showing the total number of pupils and how many of them did not meet the expected standard. When applicable, it will also display how many did not sit the test (those whose outcome was recorded as either absent, maladministration, disapplied or left).
Example sentence
The proportion of pupils who met the expected standard (32+) in phonics in Year 1 (62%) was significantly below national and in the lowest 20% in 2022. Of the 30 pupils, 9 did not meet the expected standard and 2 did not sit the test. There were 21 pupil(s) that were screened in Year 2 in 2022; 12 of those met the expected standard.
Sentences for phonics will not appear in the pupil groups section of the IDSR.
Attainment in phonics – 2019 to 2017 (not directly comparable to 2022)
A sentence for phonics will only appear under the reading subject section and will flag when there is significant high or low attainment of the expected standard for the latest 3 years, 2 years or the latest year, based on statistical significance and percentile rank. If the sentence has been triggered due to the school being below national and in the lowest 20%, an additional sentence will be displayed showing the total number of pupils and how many of them did not meet the expected standard. When applicable, it will also display how many did not sit the test (those whose outcome was recorded as either absent, maladministration, disapplied or left).
Example sentence
The proportion of pupils who met the expected standard (32+) in phonics in Year 1 (62%) was significantly below national and in the lowest 20% in 2019, as well as in 2018 and 2017. Of the 30 pupils, 9 did not meet the expected standard and 2 did not sit the test. There were 21 pupil(s) that were screened in Year 2 in 2019; 12 of those met the expected standard.
Sentences for phonics will not appear in the pupil groups section of the IDSR.
Other attainment measures
The following guidance is applicable to primary schools only.
There can be multiple sentences under each heading if your school fits the criteria of each sentence.
Key stage 2: attainment of the expected standard for combined subjects – 2022
A sentence is generated based on the proportion of pupils that reached the expected/high standard in reading, writing and mathematics combined in 2022.
The criteria that trigger this sentence require that a school is in the highest or lowest 20% of all schools and either significantly above or below the national. In 2022 due to the distribution of data it was not possible to calculate the highest and lowest 20% for the high standard in key stage 2 combined reading, writing and mathematics measure. As such this sentence is based on statistical significance alone.
Example sentence
In 2022, 36% of pupils achieved the key stage 2 expected standard in reading, writing and mathematics, significantly below national and in the lowest 20%. Two per cent of pupils achieved the high standard, which is significantly below national.
English grammar, punctuation and spelling test
A sentence is generated based on the proportion of pupils that achieved the expected (100+)/high (110+) standard in the latest year. The lowest scaled score is 80 and the highest scaled score is 120. Pupils scoring at least a scaled score of 100 will have met the expected standard of the test.
The criteria that trigger this sentence require that a school is in the highest or lowest 20% of all schools and either significantly above or below the national in 2022.
Example sentence
In 2022, 38% of pupils achieved a scaled score of 100+ in the English grammar, punctuation and spelling test, significantly below national and in the lowest 20%.
Science
The key stage 2 science sentence is generated based on the proportion of pupils that reached the expected standard in 2022.
Example sentence
In 2022, 56% of pupils achieved the key stage 2 science expected standard, significantly below national and in the lowest 20%.
Key stage 2: attainment of the expected standard for combined subjects – 2019 to 2017
A sentence is generated based on the proportion of pupils that reached the expected/high standard in reading, writing and mathematics combined in the latest 3 years, 2 years or the latest year.
The criteria that trigger this sentence require that a school is in the highest or lowest 20% of all schools and either significantly above or below the national.
Example sentence
In 2019, 36% of pupils achieved the key stage 2 expected standard in reading, writing and mathematics, significantly below national and in the lowest 20%. Two per cent of pupils achieved the high standard, which is significantly below national and in the lowest 20%.
English grammar, punctuation and spelling test
A sentence is generated based on the proportion of pupils that achieved the expected (100+)/high (110+) standard in the latest year. The lowest scaled score is 80 and the highest scaled score is 120. Pupils scoring at least a scaled score of 100 will have met the expected standard of the test.
The criteria that trigger this sentence require that a school is in the highest or lowest 20% of all schools and either significantly above or below the national in the latest 3 years, 2 years or just the latest year.
Example sentence
In 2019, 38% of pupils achieved a scaled score of 100+ in the English grammar, punctuation and spelling test, significantly below national and in the lowest 20%.
Science
The key stage 2 science sentence is generated based on the proportion of pupils that reached the expected standard in 2019.
Example sentence
In 2019, 56% of pupils achieved the key stage 2 science expected standard, significantly below national and in the lowest 20%.
Pupil movement
We have used pupil-level data from the DfE’s spring school census to identify pupils who were in Year 10 in each school in January of one year and whether they were still in the same school in January of the following year. We do not use the census data from other school terms for this analysis, for example the autumn-term census. This may mean that the figures do not match those produced by some schools or local authorities.
We developed a logistic multi-level model that uses contextual factors to estimate what proportion of pupils we might expect to leave each school. Our analysis shows that these contextual factors are associated with higher levels of pupil movement. The contextual factors that the model takes into account are pupils’ and schools’ characteristics.
The following are the pupils’ characteristics:
-
gender
-
eligibility for free school meals in the past 6 years
-
speaking English as an additional language
-
key stage 2 attainment (low, middle, high or not present in key stage 2)
-
having a special educational need and disability (SEND), especially social, emotional or mental health issues
-
being in either the White Irish Traveller or White Roma ethnic group
-
being looked after by a local authority
-
income deprivation affecting children index (IDACI) of home postcode
The model also takes into account the school characteristic of whether the school area is urban.
Example sentence
Between 2020 and 2021, 12 pupil(s) left the school. Of these, 4 pupil(s) left the school between Years 10 and 11 (6% of the Year 10 cohort), which was significantly above the number anticipated for this school this year. There is no available information about the destinations of 5 of these 12 pupil(s), 3 of whom left between Years 10 and 11.
Pupils are identified as having an unknown destination if they do not appear in the subsequent January school census in one of the following school types:
• maintained nursery • primary • middle-deemed primary • middle-deemed secondary • secondary • all-through • special schools (including non-maintained special schools) • pupil referral units / alternative provision (PRU / AP) • academies (including free schools, university technical colleges (UTCs) and studio schools) • city technology colleges (CTCs)
There are destinations outside of the census that the pupil may have moved to, which schools may have information about that they can share with inspectors.
Absence
Absence for 2018/19 and earlier2021/22
Absence data is based on 32 terms for 2018/19,2021/22 2017/18– autumn and 2016/17.spring. YouSentences canfor view2021/22 further information on absence statistics.
Sentences will appear when the rate of overall or persistent absence in the latest year was in the highest or lowest 20% for all schools or for similar schools. Similar here means the same phase of education and with a similar level of deprivation (in the same income deprivation affecting children index (IDACI) quintile).
Example sentence
The rate of overall absence (4.8%) in 2018/192021/22 was in the highest 20% of schools with a similar level of deprivation.
An equivalent sentence will flag for persistent absence.
Example sentence
The rate of persistent absence (1.3%) in 2018/192021/22 was in the lowest 20% of schools with a similar level of deprivation.
Absence for 2018/19 and earlier
Absence data is based on 3 terms for 2018/19, 2017/18 and 2016/17. You can view further information on absence statistics.
Sentences will appear when the rate of overall absence in the latest year was in the highest or lowest 20% of all schools.
Example sentence
The rate of overall absence (4.8%) in 2018/19 was in the highest 20% of all schools.
An equivalent sentence will flag for persistent absence.
Example sentence
The rate of persistent absence (1.3%) in 2018/19 was in the lowest 20% of all schools
If both the overall absence and persistent absence sentence flag the sentence will be combined. A sentence is generated when the rate of overall absence was in the highest or lowest 20% in the latest 3 years, 2 years or only the latest year.
Example sentence
Overall absence (3.1%) was in the lowest 20% of all schools in 2018/19.
An equivalent sentence will flag for persistent absence.
Example sentence
Persistent absence (20.7%) was in the highest 20% of all schools in 2018/19.
Service children’s education provider IDSRs do not incorporate 2017 data so sentences based on only the latest 2 years, or the latest year are shown.
Summer 2021 and autumn 2020 absence
Summer 2021 and autumn 2020 absence data is based on the DfE census collection and has been provided as a new section within the IDSR. This is different to the daily attendance collection that schools have submitted throughout the pandemic, which will not be used in the IDSR.
This data relates to absences during the COVID-19 pandemic. As such, users should not directly compare summer 2021 or autumn 2020 absence to historic absence rates. There may be a number of reasons for changes in absence rates. Inspectors will not use the summer 2021 or autumn 2020 absence data by itself to draw conclusions but may use it to prompt questions regarding how well-attended a school was during this period. Inspectors may also use previous years’ data to provide context to the latest data, particularly where a school has previously had high or low absence rates in relation to other schools.
It is important to note that if a pupil tested positive for COVID-19 then this absence should have been treated as an illness and included within the data. However other COVID-19 related absences, such as pupils being sent home to isolate, did not count as absences within the data.
The sentences provided are the same as those in the usual absence section, apart from an additional sentence regarding the number of sessions missed by pupils not attending in circumstances related to COVID-19.
Example sentence
This data relates to absences during the coronavirus (COVID-19) pandemic and should not be compared directly to previous years. There were 270 sessions missed by pupils not attending in circumstances related to coronavirus (COVID-19) in summer 2021 - these did not count as absence within the data. There were 2,700 sessions missed in autumn 2020 - these did not count as absence within the data.
The rate of overall absence (5.2%) in summer 2021 was in the highest 20% of all schools. In autumn 2020 (5.3%) it was in the highest 20% of all schools.
There is nothing significant or exceptional to highlight for overall absence compared to schools with a similar level of deprivation in summer 2021, therefore no conclusions can be drawn from this data. The rates of overall absence (5.1%) in autumn 2020 was in the highest 20% of schools with a similar level of deprivation.
Suspensions and permanent exclusions
Service children’s education provider IDSRs only have suspensions and permanent exclusions data for the latest academic year available.
The whole school measure includes all year groups in the school.
Whole school
For suspensions, ‘total’ relates to the number of pupils who had 1 or more suspensions during the academic year. ‘Repeat’ relates to the number of pupils who had 2 or more suspensions.
The rate of total or repeat suspensions is calculated by dividing the number of pupils suspended by the number on roll. We have profiled the national comparator for all suspensions by phase of education. Special schools are compared with the national rate for secondary schools.
The number of pupils with a permanent exclusion is provided for up to the last 3 years. The national average, profiled by phase of education, is included for the latest year. Special schools are compared with the national average for special schools.
The numbers and proportions of pupils with suspensions or permanent exclusions are often very small. These should be interpreted with caution, particularly when making comparisons over time. Additionally, the COVID-19 pandemic started during the 2019/20 reporting period. We are aware that rates of suspensions and permanent exclusions generally dropped during this year as a result. The suspensions and permanent exclusions data is one year behind. For example, 2019/20 data was published in July 2021. Suspensions and permanent exclusions data is for cohorts before the one shown on the context page and the number on roll may have changed.
Further information on pupil exclusion statistics is in the DfE’s pupil exclusion statistics methodology publication.
Suspensions
The IDSR measure for repeat suspensions is based on the number of pupils with at least 2 suspensions divided by the number on roll (headcount).
Sentences will appear when the rate of total suspensions in 2020/21 was in the highest 20% for similar schools. Similar here means the same phase of education and with a similar level of deprivation (in the same IDACI quintile). The IDSR does not produce these sentences for primary schools due to very low suspension rates.
Example sentence
The rate of total suspensions (5.76%) was in the highest 20% of schools with a similar level of deprivation in 2020/21.
An equivalent sentence will flag for repeat suspensions, or the sentence will be combined for both.
Example sentence
In 2020/21, the rates of total (5.76%) and repeat (2.23%) suspensions were in the highest 20% of schools with a similar level of deprivation.
A sentence shows when there are high proportions of total/repeat suspensions for up to 3 years. A high proportion relates to the highest quintile based on the national distribution of suspension proportions. This is profiled by phase and year, and only includes schools with cohorts greater than 10 in that year. Special schools are compared with the distribution for secondary schools. The sentence includes the school’s proportion of total/repeat suspensions for the latest year in brackets. If a sentence is not triggered for the latest 3 years, it will also show if the school is in the highest quintile for the latest 2 years. If a sentence is not triggered for the latest 3 or 2 years, it would show a sentence if the school is in the highest quintile in the latest year.
Example sentences
The rate of total suspensions (6.75%) was in the highest 20% in 2020/21, as well as in 2019/20.
The rate of repeat suspensions (4.38%) was in the highest 20% in 2020/21.
For schools with at least one pupil with a suspension in 2020/21, a sentence details the prevalence of repeat suspensions. For schools with between 1 and 10 pupils receiving a suspension, the sentence states how many received more than one. If any pupils received more than one, the sentence also states how many received 10 or more. The same applies to schools with more than 10 pupils receiving a suspension. However, the sentence quotes proportions rather than numbers of pupils.
Example sentences
Of the 7 pupils with at least one suspension in 2020/21, 4 were suspended on more than one occasion and 1 received 10 or more suspensions during the year.
Of the 56 pupils with at least one suspension in 2020/21, 34% were suspended on more than one occasion and 10.7% received 10 or more suspensions during the year.
For schools with at least 1 pupil with a suspension in 2020/21, a sentence states the most common reason and its frequency. It also includes the total number of suspensions and any other reasons accounting for 10% or more of the total, with their frequency.
Example sentence
Of the 13 suspensions in 2020/21, the following reasons each accounted for more than 10%: verbal abuse/threatening behaviour against a pupil (5), racist abuse (3), physical assault against an adult (2).
Permanent exclusions
A sentence appears for each school stating the number of permanent exclusions in each of the last 3 years, if data is available. The sentence includes the national average for the latest year, profiled by phase.
Example sentence
There was 1 permanent exclusion in 2020/21. The national average for this year was close to zero. There were none in 2019/20 but there were 2 in 2018/19.
For schools with at least 1 pupil who received a permanent exclusion, a sentence states the most common reason and its frequency. It also includes the total number of permanent exclusions and any other reasons for permanent exclusions, with their frequency.
Example sentence
Of the 2 permanent exclusions in 2020/21, both were for theft.
Key stage 5 suspensions & permanent exclusions
Key stage 5 in this section relates to year groups 12, 13 and 14 where applicable.
National averages for both suspensions and permanent exclusions are profiled by phase, special schools are compared to the secondary national.
The Department for Education supply the source data for this section.
Suspensions
Due to the low number of suspensions and permanent exclusions nationally in sixth forms it has not been possible to make the same comparisons as with the whole school measure (highest/lowest 20%). Instead, we have presented suspensions in the same way as exclusions and display the school number and national number. For this same reason the IDSR does not show repeat suspensions for sixth forms or comparisons to schools with similar levels of deprivation.
A sentence will appear stating the number of suspensions at key stage 5 in 2020/21, if there were any. The sentence will also state the national average number for the latest year. If there were also suspensions in 2019/20 and 2018/19 this information will also be presented.
Example sentence
There were 2 students in key stage 5 suspended at least once in 2020/21. The national average for this year was 1. There were also 2 in 2019/20 but none in 2018/19.
Subsequent sentences will appear that state the reason for the suspension(s) in 2020/21.
Example sentence
Of the 2 total suspensions at key stage 5 in 2020/21, the following reasons each accounted for more than 10%: physical assault against a pupil (1), physical assault against an adult (1).
Permanent exclusions
A sentence appears for each school stating the number of permanent exclusions in each of the last 3 years, if data is available. The sentence includes the national average for the latest year.
Example sentence
There was 1 permanent exclusion in 2020/21. The national average for this year was 1. There were also 3 in 2019/20 and 2 in 2018/19.
For schools with at least 1 pupil who received a permanent exclusion, a sentence states the most common reason and its frequency. It also includes the total number of permanent exclusions and any other reasons for permanent exclusions, with their frequency.
Example sentence
Of the 2 total suspensions at key stage 5 in 2020/21, both were for unspecified reasons.
Key stage 5 qualification types and retention
The qualification type table is based on revised data, whereas retention is final data.
Qualification types
This table lists the number of students undertaking each type of qualification.
Students may be working towards more than 1 type of qualification and so may be counted more than once. Students taking courses that are not full qualifications are not included. Students taking academic qualifications other than A levels are not included in the table under individual qualification types but are included in the cohort information. Therefore, the numbers in each column may not add up to the total number of students and percentages may not add up to 100.
Below the table is a sentence which is presented when there is something significant or exceptional to highlight for the proportion of students not taking any level 3 or level 2 DfE approved qualification in 2022. This highlights when a school is in the highest or lowest 20% nationally for the latest year or the latest 2 years.
Retention on main study programmes
This section provides data on the extent to which a provider retains students to the end of the main learning aim of their study programme. The measure used in this section is retained and assessed.
Students are counted in the retained and assessed measure if they are retained to the end of their course and are assessed. The assessment may not necessarily be in the same subject or type of qualification they were aiming for when their studies began. However, the assessment must be at the same level and at least the same size as the main aim. For example, a student with an original main aim of tech level at size 1 would be considered as retained and assessed with an applied general exam result of at least size 1.
Data is presented for 4 study programmes:
- A levels (including AS level)
- level 3 applied general
-
level 3 tech level
- level 2 technical certificate
From 2019, only technical certificates will be recognised as level 2 vocational qualifications in the 16 to 18 performance tables. In 2018, the DfE reported a broader range of qualifications. The DfE’s guidance on technical and vocational qualifications contains the lists of qualifications that count in 2019 performance tables.
A student’s study programme is defined based on their main aim. The DfE’s 16 to 18 accountability measures technical guide provides further information on how this is defined.
Destinations
Key stage 4
This table displays the proportion of pupils that continued to complete specified destinations. This data is publicly available and comes from the DfE’s destinations collection.
The data for the latest year relates to the pupils that sustained destinations in 2020/21. These are pupils that reached the end of key stage 4 in 201/21. The row header displays the year of completed education as the latest year. The 2017/18 destinations are based on provisional data that year and therefore may not reflect some changes in the revised dataset.
Sustained destinations include school sixth forms, further education and sixth-form colleges, as well as higher education institutions, apprenticeships and employment. For a destination to count, pupils must sustain participation for a 6-month period.
Blue boxes will indicate if a figure was, statistically, significantly above the national average. Orange boxes will indicate when a figure was, statistically, significantly below the national average. The supporting data tables provide the national figures here.
If data has been suppressed due to small cohorts, ‘small cohort’ will be shown in the table. Cohort suppression in this table follows the rules used by the DfE.
Service children’s education provider IDSRs will only have the destinations for the latest year due to data availability.
Key stage 5
This table displays the proportion of students who completed their study programme at the provider who went on to sustained education or employment, who went on to a destination not sustained or whose activity was not captured. It further shows what proportion of all students went on to an apprenticeship, to any education and to higher education.
The 2017/18 destinations are based on provisional data that year and therefore may not reflect some changes in the revised dataset.
Blue boxes will indicate if a figure was, statistically, significantly above the national average. Orange boxes will indicate when a figure was, statistically, significantly below the national average. The supporting data tables provide the national figures here.
If data has been suppressed due to small cohorts, ‘small cohort’ will be shown in the table. Cohort suppression in this table follows the rules used by the DfE.
For the destinations, the DfE use a flexible end year to determine which students are included in the measure. The DfE’s 16 to 18 accountability measures technical guide contains further information on the methodology.
This data is taken from the DfE source ‘Destinations of KS4 and 16 to 18 (KS5) students: 2019’, which includes full definitions of the measures used and further breakdowns of the data.
Pupil groups
Sentences related to the performance of pupil groups will only appear for the pupil groups disadvantaged and low/middle/high prior attainers. Absence sentences are generated for FSM, SEND and EAL.EAL and are based on 2021/22 data. They will be displayed where the group differs to that of the whole school. Exclusions and phonics pupil groups will not appear in this section.
When refreshed with 2022 performance data the groups section will only generate sentences based on that year i.e., no trend looking back to previous years.
The disadvantaged pupil group will not appear for 2022 in the initial release of the IDSR, due to late receipt of CLA (Children Looked After) data which is a constituent part of the group.
Due to COVID-19 no prior attainment groups will be displayed for the key stage 1 measures in this section for 2022.
Pupil group differences can be meaningless when analysed at school level, particularly when groups relate to small cohorts. The conversation should be about meeting the needs of all pupils.
If performance does not differ from that of the school, no sentences will appear, unless the pupil group had trend information that the overall school did not. For example, a sentence will appear if the group was in the highest 20% and significantly above national for 3 years but the whole school was in the highest 20% and significantly above national for the latest year only.
Key stage 4
Prior attainment groups are based on overall key stage 2 prior attainment, which is calculated using reading and mathematics. It was not possible to produce percentile ranks for groups in terms of the attainment for the 4plus threshold measure; this is due to the spread of data; therefore, only Attainment 8 sentences will appear in the groups section.
Key stage 5
Sentences for the prior attainment and the disadvantaged groups will appear for value added relating to A level, AS level and applied general qualifications. They will also appear for completion and attainment data relating to tech level qualifications and technical certificate qualifications
Prior attainment groups are based on students’ average points score at key stage 4, which is calculated by giving a points score to each grade and taking an average across all the students’ grades. For further detail on the methodology to determine these prior attainment groups for level 2 and level 3 please see the key stage 5 student group section.
Key stage 2
Prior attainment groups are based on overall key stage 1 prior attainment, which is calculated using reading and mathematics. It was not possible to produce percentile ranks for groups in terms of attainment at key stage 2; this is due to the spread of data and, therefore, only statistical significance tests have been performed to identify high or low performance.
Key stage 1
Prior attainment groups are based on emerging, expected and exceeding in reading, writing or mathematics early learning goals. It was not possible to produce percentile ranks for groups in terms of attainment at key stage 1; this is due to the spread of data and, therefore, only statistical significance tests have been performed to identify high or low performance. Due to COVID-19 it has not been possible to calculate prior attainment groups for KS1 as the data does not exist.
Absence
Absence sentences are generated for FSM, SEND and EAL.EAL and are based on 2021/22 data.
Note that:
-
due to small cohorts
ofof. low and high prior attainment groups, it is much less likely for sentences to appear -
it was not possible to flag group sentences for phonics attainment; this is due to the spread of the data
-
pupil group sentences for exclusions will not be shown
Service children’s education provider IDSRs do not incorporate 2017 data so sentences based on only the latest 2 years, or the latest year are shown. For the exclusion sentence, service children’s education provider IDSRs only have data for the latest academic year available.
School and local context
School characteristics
The chart shows school-level information, based on the January school census, for 2020, 2021 and 2022. If a school has a sixth form, a separate row will appear that shows the context for years 12, 13 and 14 where applicable.
The chart contains the following measures:
-
the percentage of pupils in receipt of free school meals (FSM) at the time of the January census; these pupils are those who are/have been eligible for FSM and have claimed them some time in the last 6 years (Reception to Year 11). FSM data is not collected for sixth forms.
-
the percentage of pupils whose first language is not English or believed to be other than English
-
the percentage of pupils with SEND who do not have an education, health and care (EHC) plan (SEND support)
-
the percentage of pupils with SEND and who have a statement of SEND or EHC plan
-
the number of pupils on roll
Stability is a measure of the percentage of students who were admitted to the school at the standard time of admission. The stability percentage is calculated by dividing the number of pupils who meet the stability criteria by the number of all eligible pupils (pupils in Years 1 to 11 with a single or main dual registration at the school at the time of the January school census). The stability measure is not available for school sixth forms.
A pupil is counted as stable if they either:
-
joined the school in or before September in Year 1
-
joined the school in or before the month by which at least 5% of the year group had also joined the school
-
joined the school in a month/national curriculum year combination in which at least 40% of the year group joined the school (the 40% must equate to at least 10 pupils in primary schools or 20 pupils in secondary schools)
-
joined the school in a month/national curriculum year combination in which at least 10% of the year group joined the school (the 10% must equate to at least 10 pupils in primary schools or 20 pupils in secondary schools) and the same month/national curriculum year combination met these criteria in at least one other year group within the school
For each group, school figures along with the national will show for each year. The quintile boxes compare the latest year to the national distribution for all schools. Special schools are compared with secondary school nationals.
Trust/LA level information
This section provides information about the trust or local authority that the school is part of. For example, if a school is part of a trust, it will have information about the number of schools in the trust and the latest overall effectiveness grades of the schools within the trusts. Similarly, it will show local authority information for local authority maintained schools. The overall effectiveness grade displayed relates to that of the latest full section 5 inspection.
ItThe isgrade importantprofile to note that the latest inspection grades may include grades of theschools schoolwithin before joining the trust. Between November 2017 and January 2018, we consulted on changes to our official statistics and management information.
As a resultmulti ofacademy thistrust consultation,(MAT) wewill changedonly thedisplay waythose wejudgements showreceived andby report on the latestschool inspectiononce ofthey allwere providers.part We now include the grades from the predecessor schools for schools that have not yet been inspected in their current form. This provides a more comprehensive view of the sector. For more details of the changes, see the official statistics documentsMAT. If a school hasreceived nota beengrade inspectedprior into itsjoining, currentthen form, the latestschool overallwill effectivenessbe gradecounted thereforein relatesthe to‘not theyet predecessorinspected’ school.section Thisuntil it is madeinspected clearas inpart of the IDSRMAT.
Staff absence
Sickness absence data collected in the November 2021 census relating to the 2020/21 year is affected by the COVID-19 pandemic.
It is not possible to draw accurate comparisons with previous time periods due to factors including partially limited school openings, delivery of education via virtual means in some cases, and potential differences in the recording of sickness absence. The figures relate to sickness absence only and do not include non-attendance due to, for example, isolation and shielding.
For the percentage of teachers with at least one period of sickness absence measure the IDSR displays data for the latest year and also 2018/19 (pre COVID-19), to help inspectors assess the impact the pandemic had on the school workforce.
To reduce burden during the pandemic, schools were not required to provide information on teacher absences for 2019/20.
Data on school workforce attendance during the pandemic has been collected via the Department for Education education settings survey.
Staff retention
Information on staff turnover as at the 2020 school workforce census is calculated using the number of full time equivalent (FTE) turnover leavers and the total FTE staff at the school. A school will be highlighted as having high staff turnover if the turnover rate was in the highest 20% of schools for the previous 2 years. Low staff turnover is not highlighted. Special schools are compared to primaries.
It is worth noting that turnover and leavers at a school level can be very volatile year to year. Further, when looking at rates of leavers and turnover it is important to be conscious of school size as this has a big impact on rates, particularly for small schools.
The Department for Education published school workforce information provides data for the vacant post measures as at November 2021.
The Department for Education also supplies the staff turnover source data.
Local area and school links
The local area section provides information about the level of deprivation in the local area in which the school resides, together with an aggregated pupil-derived deprivation indicator. Each deprivation indicator is based on the IDACI.
The IDACI measures the proportion of all children aged 0 to 15 living in income-deprived families. It is a subset of the income deprivation domain, which measures the proportion of the population in an area experiencing deprivation relating to low income. The definition of low income used includes both those people who are out of work and those who are in work but who have low earnings and who satisfy the respective means tests.
Please note that we have updated the IDACI (from English Indices of Deprivation) measure from 2015 to 2019. As such, some IDACI values may have changed as a result when compared to historic IDSRs.
Example sentence
The school location deprivation indicator was in quintile 2 (less deprived) of all schools. The pupil base is in quintile 4 (more deprived) of all schools in terms of deprivation.
The sentences display what quintile the deprivation level falls under. Each quintile represents a bound of 20%. The higher the quintile the greater the level of deprivation.
A school’s local area is based on the 2011 lower layer super output area (LSOA) in which it resides. LSOAs are a geographic hierarchy designed to improve the reporting of small area statistics in England and Wales. The minimum population in each LSOA is 1,000 and the maximum is 3,000. Regarding households, there is a minimum of 400 households in each LSOA and a maximum of 1,200.
You can read further information about the data used for the local area deprivation.
This section also provides information about other schools and alternative provision providers that pupils in this school were dual registered at according to the January 2022 census. The number of pupils at the school is shown in brackets.
Example sentence
According to the January 2022 census, pupils at this school were also registered at the following providers:
- Primary - School A - URN XXXXXX (1)
Service children’s education provider IDSRs will not display information on location-based deprivation in this section as they are currently not contained in the dataset.
Finance
The IDSR contains the latest financial information – for 2020/21 for both local authority maintained schools and academies – including:
-
the revenue reserve of the school (local authority maintained schools) or trust (academies)
-
the in-year balance
-
the spend per pupil
-
the level of grant funding compared with the national average for the school phase and type (local authority maintained school or academy)
For academies within MATs, central trust income and expenditure is also considered. Income and expenditure attributed to the central trust is apportioned to individual academies on a per pupil basis to provide a combined academy and trust figure for each academy.
The source for the school finance information is the data underpinning the DfE’s school financial benchmarking tool. You can also view or download the data sources.
Service children’s education provider IDSRs will not display information in this section as they are currently not contained in the dataset.
Ethnicity whole school and key stage 5
Ethnicity information comes from the January 2022 school census. The sentence states how many ethnic groups are present in the school out of 17.
The 17 possible ethnic groups are:
-
White British
-
White Irish
-
White Traveller of Irish Heritage
-
White Gypsy/Roma
-
White Any other White background
-
Mixed White and Black Caribbean
-
Mixed White and Black African
-
Mixed White and Asian
-
Mixed Any other Mixed background
-
Asian or Asian British Indian
-
Asian or Asian British Pakistani
-
Asian or Asian British Bangladeshi
-
Asian or Asian British Any other Asian background
-
Black or Black British Caribbean
-
Black or Black British African
-
Black or Black British Any other Black background
-
Chinese
This excludes the groups ‘Any other ethnic group’, ‘Parent/pupil preferred not to say’ and ‘Ethnicity not known’.
The sentence states those with 5% or more of the school. For this section ‘Any other ethnic group’, ‘Parent/pupil preferred not to say’ and ‘Ethnicity not known’ are included, so may appear in the top 5 largest groups.
Example
This school has 3 out of 17 possible ethnic groups. Those with 5% or more are:
-
71%: White - British
-
14%: Ethnicity not known
-
7%: Asian or Asian British - Indian
-
7%: Mixed - White and Black Caribbean
Year group context
Characteristics
The chart shows school-level year group characteristics, based on the 2022 January school census for the following measures:
-
number on roll
-
the percentage of pupils in receipt of FSM at the time of the January census; these pupils are those who are or have been eligible for FSM and have claimed them some time in the last 6 years (Reception to Year 11)
-
the percentage of pupils who speak English as an additional language
Shading on the chart indicates when the year group was different to other year groups in the school.
For key stage 5 (where applicable), there are different rules that the DfE uses to allocate students to the different measures. The year group characteristics are based on the census data, so there may be students that are no longer on roll but still allocated to the provider for accountability purposes.
Prior attainment
The prior attainment table presents how pupils in school performed at the previous key stage in relation to their year group.
We have based prior attainment in 2022 on the following factors:
-
for Years 1 ,2, 3 and 4 there is no prior attainment data due to COVID-19
-
for Years 5 and 6 we have based this on the percentage who achieved at least the expected standard at key stage 1
-
for Years 7 and 8 there is no prior attainment data due to COVID-19
-
for Years 9, 10 and 11 we have based this on those achieving the expected standard at key stage 2
Shading indicates whether the pupils in this school were above or below national. This is triggered if the school value is 1 or 2 standard deviations from the national. If pupils were in line with national, a dash is shown. If the number of pupils was 10 or below, an ‘X’ is shown.
Prior attainment at key stage 5
There was no data available for key stage 5 prior attainment in 2022. This is because these pupils did not take key stage 4 exams in 2020, due to COVID-19.
SEND characteristics
There is a formal assessment to decide if a pupil needs a statement of SEND or an EHC plan.
SEND support is the help a school gives pupils that falls outside the usual curriculum. Outside specialists can tell or support the class teacher and SEN coordinator.
An EHC plan is for children and young people aged up to 25 who need more support. This extra help is not available through SEN support. EHC plans identify educational, health and social needs and set out the support to meet those needs.
The January 2022 census provides data for this table. The table displays the number of pupils in the school who have SEND and what the need category is. The 2 halves of the table represent pupils who have SEND support and pupils who have an EHC plan.
It also shows what year the pupil is in. It flags if the school has a SEND unit and how many SEND pupils are disadvantaged.
SEND units are special provisions within a mainstream school. These units contain separate classes to teach pupils with SEND. These units:
-
receive extra funding from the local authority
-
cater for a specific type or types of SEND (for example, autistic spectrum disorders)
-
are usually for pupils with statements or EHC plans (but this is not required)
Disadvantaged pupils are those who were eligible for FSM at any time during the last 6 years and children looked after (in the care of the local authority for a day or more or who have been adopted from care).
Resourced provision refers to the places reserved at a mainstream school for specific pupils with SEND. The pupils learn within mainstream classes but require some specialist facilities.
Resourced provision:
-
receives extra funding from the local authority
-
caters for a specific type or types of SEN, for example specific learning difficulties
-
is usually for pupils with statements or EHC plans, but this is not required
The resourced provision information comes from the DfE’s GIAS service.
Progress and attainment trend
Progress 8: three-year trend
This section shows the relative performance of the school for Progress 8 and each of the Progress 8 elements in 2022 versus the national using significance tests. A blue box indicates when a figure was, statistically, significantly above the national average. Orange boxes will indicate when a figure was, statistically, significantly below the national average. Quintiles have not been used in this chart to avoid direct comparison between schools during a volatile period. Note that sentences in the areas to investigate section will still report on the highest and lowest 20% along with significance.
The Progress 8 3-year trend section shows how the school has performed compared with other schools nationally, overall and for each of the Progress 8 elements for each of the last 3 years, regardless of the methodology at the time. There is a clear indication of the position in terms of the quintile, when each quintile represents 20% of schools. Red boxes will indicate when a figure was, statistically, significantly below the national average. Green boxes will indicate when a figure was, statistically, significantly above the national average. Quintiles will display an ‘X’ when they are based on cohorts of 10 or fewer pupils. Also, no statistical significance will show for cohorts of 10 or fewer pupils.
The arrows indicate an increase or decrease in progress score. These align with the progress trend analysis. We have only made comparisons between 2017–18, and 2018–19. This is referred to as markedly higher or lower in the legend of the progress and attainment trend chart. Note that this is not based on statistical significance testing. The number in brackets shows the eligible cohort. The calculation that underpins these is shown in the ‘Understanding the data in the IDSR’ section.
Service children’s education provider IDSRs do not incorporate 2017 data, so only the latest 2 years will have content.
Value added three-year trend
This section shows the relative performance of the school for value added in key stage 4 EBacc pillars in 2022 using significance tests. Orange boxes will indicate when a figure was, statistically, significantly below the national average. Blue boxes will indicate when a figure was, statistically, significantly above the national average. Quintiles have not been used in this chart to avoid direct comparison between schools during a volatile period. Note that sentences in the areas to investigate section will still report on the highest and lowest 20% along with significance. It has not been possible to show KS5 data in 2022 due to the value added measure not being available due to COVID-19.
The EBacc pillar value added 3-year trend section shows how the school has performed compared with other schools nationally for science, languages and humanities value added for each of the last 3 years, regardless of the methodology at the time. There is a clear indication of the position in terms of the quintile, when each quintile represents 20% of schools. Red boxes indicate when a figure was, statistically below the national average. Green boxes indicate when a figure was, statistically above the national average. Quintiles will display an ‘X’ when they are based on cohorts of 10 or fewer pupils.
Level 3 value-added data is shown for A level, AS level and applied general qualifications. Red boxes indicate if the score was statistically significantly below the national average. Green boxes indicate if a score was statistically significantly above the national average.
The ‘A level’ group includes the following A level qualifications:
-
A level
-
applied A level single award
-
applied A level double award
The ‘AS level’ group includes the following AS level qualifications:
-
AS level (not continued to full A level)
-
applied AS level single award
-
applied AS level double award
For reference, the ‘A level group’ DfE report combines these 2 groups together.
Service children’s education providers do not have data for value added measures.
Attainment 8: three-year trend
This section shows the relative performance of the school for Attainment 8 and each of the Attainment 8 elements in 2022 using significance tests. A blue box indicates when a figure was, statistically, significantly below the national average. Orange boxes will indicate when a figure was, statistically, significantly above the national average. Quintiles have not been used in this chart to avoid direct comparison between schools during a volatile period. Note that sentences in the areas to investigate section will still report on the highest and lowest 20% along with significance.
The Attainment 8 3-year trend section shows how the school has performed compared with other schools nationally for overall Attainment 8 and each of the Attainment 8 elements: English, mathematics, EBacc and open. The school is compared with other schools nationally for each of the last 3 years, regardless of the methodology at the time. There is a clear indication of the position in terms of the quintile, when each quintile represents 20% of schools. Quintiles will display an ‘X’ when they are based on cohorts of 10 or fewer pupils.
Service children’s education provider IDSRs do not incorporate 2017 data, so only the latest 2 years will have content.
Attainment thresholds three-year trend
This section shows the relative performance of the school for attainment in key stage 4 EBacc pillars and key stage 5 in 2022. Orange boxes will indicate when a figure was, statistically, significantly below the national average. Blue boxes will indicate when a figure was, statistically, significantly above the national average. Quintiles have not been used in this chart to avoid direct comparison between schools during a volatile period. Note that sentences in the areas to investigate section will still report on the highest and lowest 20% along with significance.
The EBacc pillar grade 4+ 3-year trend section shows how the school has performed compared with other schools nationally for the percentage of pupils achieving grade 4+ in science, languages and humanities. The school is compared with other schools nationally for each of the last 3 years, regardless of the methodology at the time. There is a clear indication of the position in terms of the quintile, when each quintile represents 20% of schools. Quintiles will display an ‘X’ when they are based on cohorts of 10 or fewer pupils.
The A level AAB% 2-year trend section shows how the school performed compared with other schools nationally for the % shows the percentage of students who have achieved 3 A levels at grades AAB or better, of which at least 2 are in facilitating subjects. The facilitating subjects are:
-
biology
-
chemistry
-
physics
-
mathematics
-
further mathematics
-
geography
-
history
-
English literature
-
classical/modern languages
Key stage 5 attainment 2-year trend
This section shows the relative performance of the school for key stage 5 average point scores in 2022. Orange boxes will indicate when a figure was, statistically, significantly below the national average. Blue boxes will indicate when a figure was, statistically, significantly above the national average. Quintiles have not been used in this chart to avoid direct comparison between schools during a volatile period. Note that sentences in the areas to investigate section will still report on the highest and lowest 20% along with significance.
The APS 2-year trend section shows how the school performed compared with other schools nationally based on average point score the following: A level, best 3 A levels, applied general, tech level (level 3) and technical certificates (level 2).
Average progress score (APS) per entry is calculated by dividing the total number of points achieved by students by the total size of entries for those students. This is then aggregated to give an overall APS score for a provider. Entries are based on the size of the qualification and students may contribute multiple qualifications to the measure. Students may also be counted in more than 1 qualification type.
Service children’s education provider IDSRs do not incorporate 2017 data, so only the latest 2 years will have content.
Reading, writing and mathematics three-year trend - 2019 to 2017
The following guidance is relevant for schools with a primary phase.
This section shows how the school has performed compared with other schools nationally overall and for each element for each of the last 3 years, regardless of the methodology at the time. There is a clear indication of the position in terms of the quintile, when each quintile represents 20% of schools. Red boxes will indicate when a figure was, statistically, significantly below the national average. Green boxes will indicate when a figure was, statistically, significantly above the national average. As in the rest of the report, figures are displayed in grey when they are based on 10 or fewer pupils. Also, no statistical significance will show for cohorts of 10 or fewer pupils.
The arrows indicate an increase or decrease in progress score. These align with the progress trend analysis. We have only made comparisons between 2017/18, and 2018/19. This is referred to as markedly higher or lower in the legend of the progress and attainment trend chart. Note that this is not based on statistical significance testing. The calculation that underpins these is shown in the ‘Understanding the data in the IDSR’ section. The number in brackets shows the number of entries.
For 2022 no quintiles are displayed. Orange boxes will indicate when a figure was, statistically, significantly below the national average. Blue boxes will indicate when a figure was, statistically, significantly above the national average.
Other attainment measures – 2019 to 2017
The following guidance is relevant for schools with a primary phase.
This section shows how the school has performed compared with other schools nationally overall and for each element for each of the last 3 years. There is a clear indication of the position in terms of the quintile, when each quintile represents 20% of schools. Red boxes will indicate when a figure was, statistically, significantly below the national average. Green boxes will indicate when a figure was, statistically, significantly above the national average. As in the rest of the report, figures are displayed in grey when they are based on 10 or fewer pupils. Also, no statistical significance will show for cohorts of 10 or fewer pupils.
For 2022 no quintiles are displayed. Orange boxes will indicate when a figure was, statistically, significantly below the national average. Blue boxes will indicate when a figure was, statistically, significantly above the national average.
Subject entries
Subject entries at key stage 4
This section shows the subjects entered for by this school in 2022, 2021 and 2019. Subject entries data for 2020 is not available. There may be some differences between 2021 entries and earlier years. For example, in 2021 early entries are not included but are included for earlier years.
The purple shading is darker where more pupils were entered. Subjects are grouped by subject cluster and listed alphabetically first by cluster then by subject. This is based on the subject families and clusters shown in Table 1.
Table 1: Mapping of subject families to subject clusters
Qualification type is also included, which covers the following:
-
AS
-
EBacc AS
-
EBacc GCSE
-
EBacc L1/L2 cert
-
Free Standing Maths level 3
-
GCSE
-
Graded music
-
L1/L2 cert
-
Level 1
-
Level 1/2
-
Level 2
-
Other at level 1
-
Other at level 2
The cohorts above the section represent total pupils at the end of key stage 4.
Subject entries at key stage 5 – level 3
This section shows the subjects entered for by this school in 2022, 2020 and 2019, however 2022 entries are not currently available. Subject entries data for 2020 is not available.
The purple shading is darker where more students were entered. Subjects are grouped by subject cluster and listed alphabetically first by cluster then by subject.
Qualification type is also included, which covers the following:
-
A level
-
applied single award
-
applied double award
-
pre-U principal
-
international baccalaureate
The cohorts above the section represent total students at the end of key stage 5.
Understanding the data in the IDSR
Statistical significance
Assessment data and information are starting points for inspectors’ discussion with schools. Statistical significance testing is used in the IDSR to draw attention to noteworthy values. These values show when differences in school’s performance may be due to more than chance variation. The IDSR uses percentile ranking as well as statistical significance testing. This allows us to look at relative performance across time while also highlighting noteworthy changes.
Significance calculation for threshold measures
A normal approximation to the binomial distribution is used to identify statistically significant differences between proportions of pupils (shown in the areas of interest).
Before applying the test, we check that:
nP
and
n(1-P)
are greater than or equal to 5.
When:
-
P represents the national average of pupils reaching the expected standard
-
n represents the total number of pupils
The calculation is as follows:
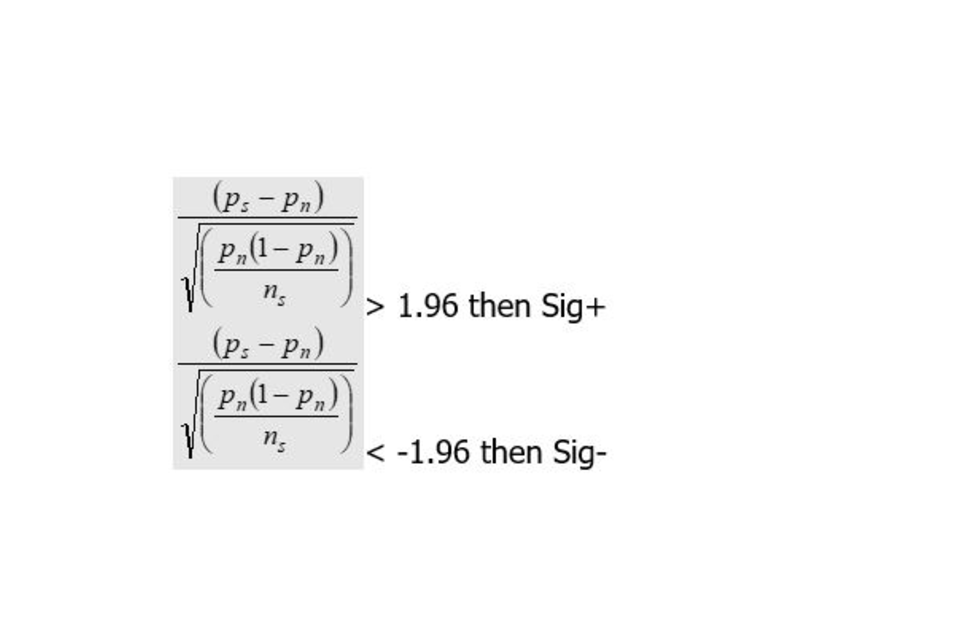
Otherwise not statistically significant.
When:
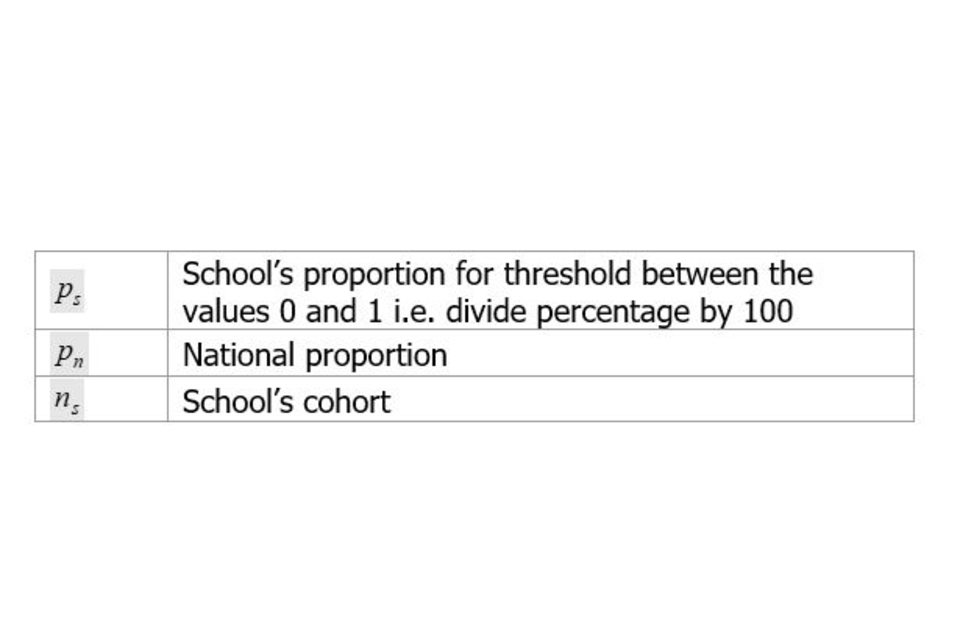
This methodology is applied to the following performance measures:
-
key stage 2 expected standard and high standard/greater depth thresholds
-
key stage 1 expected standard and greater depth thresholds
-
Year 1 phonics
-
destinations
Progress trend analysis calculation
Progress is a within year, norm referenced measure. Scores are not directly comparable year on year. To allow for direct comparisons across years, every progress score is standardised using the following formula:
(Progress score – mean) / standard deviation
Absence and exclusions
Absence data is usually in all IDSRs by December each year. This is because data is only provided to Ofsted after the primary IDSR release.
The permanent exclusions and fixed-periodsuspensions exclusions data is one year behind. For example, 2017/18 exclusions data was published in July 2019. Exclusions data is for cohorts before the one shown on the context page and the number on roll may have changed.
For absence and fixed-periodsuspensions, exclusions, special schools are compared to the national for secondary schools. For permanent exclusions, special schools are compared to the national average for special schools.
Data sources
All data in the IDSR is from the DfE. We use the data to calculate school-, local-authority- and national-level data. Pupil-level data is anonymous and does not contain names or addresses. It is not shared with inspectors at any point.
We receive the following data sets from the DfE to produce the IDSR.
National pupil database:
-
key stage 1 and phonics
-
school census to populate contextual sections
-
ASP all key stages
Performance tables:
-
school and college database (SCDB) primary and secondary
-
key stage 2
-
key stage 4
-
key stage 5
-
level 3 value added
Absence and exclusions data:
-
school-level exclusions
-
2-term absence
-
3-term absence
-
1-term absence (autumn 2020)
-
1-term absence (summer 2021)
You can find more information on the accountability measures in these DfE guidance documents:
-
secondary accountability measures (including Progress 8 and Attainment 8)
Special schools and pupils with special educational needs and disabilities
An IDSR is produced for special schools. However, it may contain very little information about the performance of pupils.
Pupils with SEND are a diverse group with differing needs and expectations. Therefore, the IDSR will no longer display any averages for this group.
Contextual information is provided for the group, including the breakdown of the number of pupils with SEND by primary special educational need.
Junior and middle schools
A standard sentence appears to explain that junior and middle schools have lower progress scores on average. Also, due to the age range of pupils at middle schools, pupils will have only attended a middle school for a short time before they take their key stage 2 tests.
Inspectors should be aware of this and, as with any inspection, carefully consider a range of information and data.
Missing data
There are a few possible reasons why data for some years is not shown for a particular measure.
In charts and tables, data may not be shown for some years because:
-
the measure did not exist, was defined differently or was not available to Ofsted for that year; if this is the case, the data is shown as a dash
-
the school had no pupils for a particular measure in that year; if this is the case, the cohort will be shown as a 0 and a dash will be shown for the measure
-
if the school recently changed legal status, for example from a local authority maintained school to a sponsor-led academy, the data may be shown under the predecessor school name or unique reference number (URN) in ASP
National figures
The national figures may differ from the figures published in the DfE performance tables and ASP. This is due to the varying decimal precisions used between organisations.
The disadvantaged pupil group is compared to the national for pupils who are not disadvantaged.
Prior attainment pupil groups are compared to their respective pupil group nationally.
Service children’s education providers have been assigned a phase based on the ages of pupils in the school.
Cohorts and numbers of pupils included
Cohorts display the total number of pupils based on the group and year of the measure presented.
For measures when all pupils were entered, the cohort shows the number of pupils the measure is based on. For some measures, it is used as the denominator for percentages.
If there have been any leavers and joiners, then the cohort number shown on progress and attainment data may not match the context section. The context section is a snapshot of the day the school census is taken in January of that year.
The ‘number of pupils included’ on progress pages only includes pupils with prior attainment information.
Key stage 5 cohorts
There are different rules that DfE uses to allocate students to the different measures. The year group characteristics is based on the census data so there may be students that are no longer on roll but still allocated to the provider for accountability purposes. The qualification type table is based on revised data, whereas retention is from final.
For the destinations, the DfE use a flexible end year to determine which students are included in the measure. There are more details in the accountability guide.
Conditions of use
The IDSR conditions of use and storage are that:
-
the IDSR is to be used only for educational and analytical purposes and for informing inspection, not for any other purpose
-
data presented in the IDSR is to be shared only with those who need and are authorised to have access to the information
-
only nominated users may access the IDSR and these users must be made aware that they cannot share the IDSR without permission from the data owner
-
the IDSR should be saved in a secure location with limited access
Key stage 5 student groups
Prior attainment student groups are shown for some measures. These groups are based on students’ average points score at key stage 4, which is calculated by giving a point score to each grade and taking an average across all the student’s grades. The following table shows the corresponding points scores for each grade.
| GCSE grade (old grading structure) | Points score |
|---|---|
| A* | 8.5 |
| A | 7 |
| B | 5.5 |
| C | 4 |
| D | 3 |
| E | 2 |
| F | 1.5 |
| G | 1 |
| U | 0 |
Note that in 2017, 2018 and 2019, points were allocated to new GCSEs (with grades of 9 to 1). The DfE’s secondary accountability measures guidance contains further details on how these scores are calculated.
In the IDSR, we use groups of scores. For level 3 students, these are as follows:
-
students with prior attainment grades 7–9 (equivalent to grades A*–A under the old grading structure)
-
students with prior attainment grades 4–6 (equivalent to grades B–C under the old grading structure)
-
students with prior attainment grades 3 and under (equivalent to grades D–G under the old grading structure)
To align students’ average points scores to these groups, we calculate an upper bound and lower bound for each group.
To calculate the upper bound for each group, we calculate the midpoint between the maximum points score within the group and the minimum points score within the next highest group.
For example, to calculate the upper bound for the 4–6 group, we take the midpoint between the maximum points score for the 4–6 group (5.5) and the minimum points score for the 7–9 group (7):
Upper bound = (5.5 + 7) / 2 = 6.25
Similarly, to calculate the lower bound for each group, we calculate the midpoint between the minimum points score for the group and the maximum points score for the next lowest group.
For example, to calculate the lower bound for the 4–6 group, we take the midpoint between the minimum points score for the 4–6 group (4) and the maximum points score for the 3 and under group (3):
Upper bound = (3 + 4) / 2 = 3.5
These calculations produce the following average points score boundaries.
| GCSE grade group | Average points score boundaries |
|---|---|
| 7–9 | 6.25 and above |
| 4–6 | 3.5–6.25 |
| 3 and under | 0–3.5 |
For level 2 students, we follow an equivalent process to calculate average points score boundaries for the following groups.
| GCSE grade group | Average points score boundaries |
|---|---|
| 3-9 | 2.5 and above |
| 2 | 1.25–2.5 |
| 1 and under | 0–1.25 |
For value-added data relating to A level, AS level and applied general qualifications, and completion and attainment data relating to tech level qualifications, the following groups based on prior attainment for level 3 students are shown:
-
students with prior attainment grades 7–9 (average points score of 6.25 or higher)
-
students with prior attainment grades 4–6 (average points score of 3.5 or above up to, but not including, 6.25)
-
students with prior attainment of 3 and under GCSE point score (average points score below 3.5)
For completion and attainment data relating to technical certificate qualifications, disadvantaged students and the following groups based on prior attainment for level 2 students are shown:
-
students with prior attainment grades 3–9 (average points score of 2.5 or higher)
-
students with prior attainment grade 2 (average points score of 1.25 or above up to, but not including, 2.5)
-
students with prior attainment grade 1 and under (average points score below 1.25)
If performance does not differ from that of the provider, no sentences will appear.
Data protection
When accessing the data in the Ofsted IDSR service, you must recognise the privacy of that data and always comply with the Data Protection Act 2018. The Data Protection Act 2018 is the UK’s implementation of the General Data Protection Regulation (GDPR). You must ensure that you use the data that you have access to for the purpose for which the service was set up and that you do not use the data for any other purpose. You must ensure that the data is processed securely and that it is not subject to any unauthorised use or disclosure.
Last updated
-
Updated with absence data.
-
Ofsted has released the 2022 secondary IDSR and the guidance has been updated to reflect this. The main changes include the release of 2022 key stage 4 attainment and progress data, key stage 5 attainment and developments to the pupil movement section.
-
Ofsted has released the 2022 primary IDSR and the guidance has been updated to reflect this. The main changes are latest 2022 key stage 2, key stage 1, phonics, contextual data and 2020/21 suspensions and permanent exclusions. Also included are updates on the new functionality to remove sentences highlighted in grey.
-
Guidance updated to reflect that EYFS profile data is no longer included in the inspection data summary report (IDSR).
-
Updated with absence and finance data.
-
The guidance has been updated to reflect the new web-based IDSR format, new data received since their last release and the integration of school sixth form guidance.
-
Guidance updated in response to user queries, including information on what ‘not authorised’ means, clarification on average number of qualifications for 2021 and further details about the stability measure.
-
Ofsted have released a November 2021 IDSR and the guidance has been updated to reflect this. The main changes are latest 2021 contextual data, a new section for 2021 subject entries and new terminology for suspensions. Supporting tables spreadsheet updated: 2021 prior attainment national averages, autumn 2020 absence bounds, suspensions bounds have been updated or added to for 2021. No performance bounds have been updated. Sentence master list updated to reflect minor improvements/changes/combinations to current area of interest sentences and incorporating 2020 and 2021 figures where applicable.
-
New section of guidance added for the release of autumn 2020 absence data. This data is based on the DfE census collection and has been provided as a new section within the IDSR.
-
Added two spreadsheets: sentence master list and supporting data tables.
-
Guidance amended to reflect the latest version of the IDSR, including example reports.
-
Updated guidance to incorporate the addition of 'service children education providers' and the supporting tables have been updated to reflect the release of revised key stage 4 data.
-
Updated to include final 2019 EYFS, supporting tables updated with revised KS2, data for disadvantaged pupils and final 2019 EYFS and a new master list of all 2019 areas of interest sentences.
-
Updated the guidance to enhance users understanding of the ‘grey’ area of interest sentences and added more direct links for ease of use.
-
Updated supporting data tables to include key stage 1 attainment of the expected standard by Early Years Foundation Stage prior outcome.
-
Updates the 'English Baccalaureate entry' section.
-
Updated guide and data tables following further releases of data.
-
Added IDSR guidance for secondary schools.
-
Added a link to the DfE Sign-in for users to log into Analyse School Performance to view and download their schools' IDSR. Also added an example secondary school IDSR.
-
Added 2019 supporting data tables.
-
Added an example inspection data summary report.
-
First published.
Update history
2026-07-10 09:21
We have updated the IDSR for all schools with the DfE’s 2025/26 daily attendance collection up to and including summer part 1. The IDSR guidance has been updated to reflect this latest update.
2026-06-05 09:46
We have updated the IDSR for all schools with the DfE’s 2025/26 daily attendance collection up to and including spring part 2. The IDSR guidance has been updated to reflect this latest update.
2026-05-15 10:11
We have updated the IDSR for all schools with spring 2024/25 suspensions and permanent exclusions data. The IDSR guidance has been updated to reflect this latest update.
2026-04-24 09:58
We have updated the IDSR for all schools with the latest and final data. The IDSR guidance has been amended to reflect these latest updates.
2026-03-27 09:37
We have updated the IDSR for all schools with the DfE’s 2025/26 daily attendance collection up to and including spring part 1. The IDSR guidance has been updated to reflect this.
2026-03-13 10:18
We have updated the IDSR for all schools with latest pupil movement data, introduced new format summary tables and updated the methodology underpinning the gap trend. The IDSR guidance has been updated to reflect these changes.
2026-03-02 09:53
The guidance has been updated to reflect that we have updated the IDSR for all schools with new daily attendance data.
2026-02-13 10:23
We have updated the IDSR for all schools with the latest available data including revised 16 to 18 performance data. The IDSR guidance has been updated to reflect these updates.
2026-02-06 11:02
We have updated the IDSR for all applicable schools with revised key stage 4 data. The IDSR guidance has been updated to reflect these updates.
2026-01-23 10:34
We have updated IDSRs with 2024/25 autumn term exclusions data. The IDSR guidance has been updated to reflect this change.
2025-12-05 12:10
We have updated the IDSR for all applicable schools with 2025 revised key stage 2, provisional 16 to 18, final phonics, 2 term absence and final multiplication tables check data. The IDSR guidance has been updated to reflect these updates.
2025-11-21 09:54
We have updated the IDSR for all schools with provisional 2025 key stage 4 data. The IDSR guidance has been updated to reflect this change.
2025-11-04 10:28
We have released the 2025 provisional primary IDSR, with several developments for the renewed inspection framework, for all schools. The IDSR guidance now reflects all new developments and data updates. The main data updates are the latest 2025 key stage 2, phonics, contextual data, 1-term absence, final exclusions for 2024 and new alternative provision placements data.
2025-05-01 10:54
We have updated the IDSR for all applicable schools with final key stage 2, key stage 4 and 16 to 18 data. We have also updated absence data with the final 3-term data. The IDSR guidance has been updated to reflect this change.
2025-03-06 11:19
We have updated the IDSR for all secondary schools with revised 2024 key stage 4 and level 3 value-added data. The IDSR guidance has been updated to reflect this update.
2025-02-06 11:48
We have updated the IDSR for all schools with revised 2024 key stage 2 and 16 to 18 performance data. The IDSR guidance has been updated to reflect this change.
2025-01-16 14:09
Updated the IDSR for all secondary schools with provisional 2024 key stage 4 data. The IDSR guidance has been updated to reflect this change.
2024-12-12 10:17
Updated the IDSR guidance for all schools with 2-term (autumn & spring) absence data for 2023/24, provisional destinations data for 2022/23, final phonics data for 2024, and multiplication tables check (MTC) data for 2024.
2024-10-10 11:16
We have released the 2024 primary IDSR with IDSR developments for all schools, as highlighted in our September newsletter. The guidance now reflects all new data updates. The main data updates are the latest 2024 key stage 2, phonics, contextual data, 1-term absence, final exclusions for 2023 and new alternative provision placements data.
2024-05-02 09:30
We have updated the IDSR for all schools with final (key stages 2, 4 and 16 to 18) 2023 data as well as 3-term absence. The guidance has been updated to reflect these changes.
2024-03-06 09:30
We have updated the IDSR for all secondary schools with revised 2023 key stage 4 and 16 to 18 data. The guidance has been updated to reflect these changes.
2024-02-07 09:30
We have updated the IDSR for all schools including schools with a sixth form with the latest pupil movement data for 2022/23 and revised key stage 2 data. We have updated the IDSR for all schools including schools with a sixth form, with the latest pupil movement data for 2022/23, and revised key stage 2 data. The guidance has been updated to reflect these changes.
2023-12-13 10:21
We have updated the IDSR for all schools including schools with a sixth form with the latest absence data for 2022/23 (autumn and spring terms), final key stage 1 and final multiplication tables data. The guidance has been updated to reflect these changes.
2023-11-15 09:37
We have updated the IDSR for secondary schools and schools with a sixth form, with the latest provisional 2023 key stage 4 and 16 to 18 data. The guidance has also been updated to reflect these changes.
2023-10-18 10:16
We have released the 2023 primary IDSR with IDSR developments for all schools, as highlighted in our last newsletter. The main data updates are latest 2023 key stage 2, key stage 1, phonics, contextual data and 2021/22 suspensions and permanent exclusions.
2023-06-07 09:30
We have updated the inspection data summary report (IDSR) for all schools. The main changes includes the 16 to 18 final 2022 data, including the updated retention measure. We also updated the trust/local authority level information section to include the most recent inspection outcome (graded or ungraded) based on latest URN for trusts only.
2023-05-04 09:30
We have updated the inspection data summary report (IDSR) for all schools.The following data has been updated: Key stage 4 – final, Key stage 2 – final (including the multiplication tables check) and absence data – 3 terms.
2023-03-22 09:30
Updated the secondary inspection data summary report (IDSR). The main changes are revisions to key stage 4, 16-18 data, pupil movement between 2021 and 2022 and destinations data. Also included are changes to the way we calculate key stage 4 subject entries.
2023-02-14 09:30
Updated the primary inspection data summary report (IDSR). The main changes are revised key stage 2, final key stage 1 and final phonics data. Also included are minor changes to the pupil movement section of the secondary school IDSR.
2022-12-15 09:30
Updated with absence data.
2022-11-17 10:54
Ofsted has released the 2022 secondary IDSR and the guidance has been updated to reflect this. The main changes include the release of 2022 key stage 4 attainment and progress data, key stage 5 attainment and developments to the pupil movement section.
2022-10-20 09:30
Ofsted has released the 2022 primary IDSR and the guidance has been updated to reflect this. The main changes are latest 2022 key stage 2, key stage 1, phonics, contextual data and 2020/21 suspensions and permanent exclusions. Also included are updates on the new functionality to remove sentences highlighted in grey.
2022-06-07 09:21
Guidance updated to reflect that EYFS profile data is no longer included in the inspection data summary report (IDSR).
2022-05-19 09:30
Updated with absence and finance data.
2022-02-28 14:00
The guidance has been updated to reflect the new web-based IDSR format, new data received since their last release and the integration of school sixth form guidance.