School inspection data summary report (IDSR) guide
This guide provides an overview of the inspection data summary report (IDSR) for primary and secondary schools, including schools with a sixth form and gives guidance on interpreting the data.
Applies to England
Overview of the Ofsted IDSR
InspectorsThe useIDSR theis inspectiona dataweb-based summarypage reportfor (IDSR)Ofsted inspectors to use when preparing for,for and during,during schoolinspection. inspections.It Theis IDSRintended as a tool for inspectors, which summarises and analyses the available data about athat school.school Itto support the inspection. The IDSR is also designed to align with our school inspection handbook, to inform inspectors’inspection conversationsconversations. with school leaders. It is not intended to be an exhaustive profile of athe school or toto, in itself, provide any judgement or assessment of thea school.
The IDSR can contain sensitive information about schools and colleges. It is your responsibility to makeensure surethat you store and share the IDSR securely.is stored and shared appropriately. Please see our IDSR conditions of use and storage statement.
DuringFor aphonics, schoolkey inspection,stage inspectors1 gather evidence on the quality of education from various sources. This includes nationally generated information on pupils’ progress and attainment.key Thestage IDSR2 candata, only provide a starting point, however. Inspectors will want to see first-hand evidence of the qualitystandards ofhave educationbeen askept experiencedconsistent bybetween pupils2022 and to2023 understanddata; howtherefore, well leaders know what it is likepossible to becompare adata pupilacross atthese theyears. school.
TheHowever, Ofstedthe IDSR iswill designednot to:
-
reduce
directlythecomparetimevaluesspentacrosspreparingyears.forForankeyinspection -
interpret
stagethe4dataandfor16inspectors -
minimise
tothe18,needdueto discussasmalldifferentgroupsgradingduringapproachinspections,inso2022,thatittheseisconversationsnotcanpossiblefocustoonmakehowdirectthecomparisonsschoolbetweenmeets2022the needs of all pupils
The standards for phonics and key2023. stageAs 2with dataprimary havedata, been kept consistent since 2022. For key stage 4 and education for 16- to 18-year-olds, the approach to grading was different in 2022 compared with subsequent years. The IDSR does not make direct comparisons across years. Instead, itthe usesIDSR arrows tocontains showarrows that indicate whether the school’sschool value has changed compared with the national value each year.year has changed. There are further details about how the arrows are calculated later in this document.
ExampleAnonymised IDSRs
These exampleanonymised IDSRs containare fictionalexamples data(fictional data) for a primary school and a secondary school with a sixth form:
IDSRsIDSR reports are dynamically generated based on school data and willcan differ from school to school.
Access your school’s Ofsted IDSR
As a web page through our website
You can access theit report directly through our new Ofsted IDSR service or throughfrom the Department for Education (DfE)’s Analyse School Performance (ASP) service. You will need a DfE Sign-in account and associated permissions for the school(s). UsersWe recommend that users with more than 1 school should use our direct link.
Ofsted cannotcan’t give or take away access toor add schools within DfE Sign-in,Sign-in. or add schools. But the approver for your schoolschool/organisation or organisation will be able to help. To find out who your approverapprover, is,please loglogin in to your DfE Sign-in account and click on the ‘Services’ tab. Then click on ‘See approvers at an organisation’.
Download and use offline
If you want to use the IDSR offline, you have several options.
Option 1 – click the ‘download this page’ button located at the top of the web page. This will download the HTML page automatically to your downloads folder. You do not need an internet connection to view and share it.
Option 2 – click the ‘print this page’ button. This will take you to the print configuration page where you can print as a hard copy document.
Option 3 – click the ‘print this page’ button. This will take you to the print configuration page where,where under ‘printer’,printer you can select ‘save as PDF’. This will convert the page into a PDF which you can then savebe saved and share.shared. (Please note that this dependsis reliant on you having the correct up-to-date software. ThisOlder versions may not worksupport this functionality.)
Ofsted IDSR
As outlined in the school inspection handbook, inspectors will gather evidence of the impact of the quality of education from various sources. This includes nationally generated performance information about pupils’ progress and attainment. The IDSR can only provide a starting point, however. Inspectors want to see first-hand the quality of education as experienced by pupils and understand how well leaders know what it is like to be a pupil at the school.
The Ofsted IDSR has been designed to:
reducethetimespentpreparingforaninspectionprovideinterpretationofthedataforinspectorsminimisethefocussmallversions.)groupsthatdistracttheconversationawayfrommeetingtheneedsofallpupils
Where applicable, the Ofsted IDSR contains:
Schoolcharacteristics–basedon2023,2022and2021dataEthnicity–basedon2023dataPriorattainment–basedon2023priordataSENDcharacteristics–basedon2023dataStaffing–basedon2022,2021and2020dataLinkstoalternativeprovisionandotherproviders–basedon2023dataAbsence–basedon2022/23(3term)and2021/22(3term)dataSuspensionsandpermanentexclusions–basedon2021/22,2020/21and2019/20dataPupilmovement–basedonmovementbetweenJan2022andJan2023census,Jan2021andJan2022censusProgressandattainmentatkeystages1and2–basedon2023dataSubjectentriesatkeystage4–basedon2023,2022and2021dataProgressandattainmentatkeystage4–basedon2023,2022and2019dataDestinationsatkeystage4–basedon2020/21,2019/20and2018/1916to18qualificationtypes–basedon2023,2022and2019data16to18retention–basedon2023,2022and2019dataSubjectentriesat16to18–basedon2023and2022dataAttainmentat16to18–basedon2023,2022and2019dataDestinations16to18–basedon2020/21,2019/20,and2018/19Pupilgroupsdata–basedon2023(primary),2023(secondary)and2022/23(3termabsence)
Reporting data issues
The data in the IDSR is largely provided by the Department for Education (DfE.). If your questionquery isrelates aboutto theissues with values displayed, such as the Progress 8 score or cohort, checkhave you checked if the IDSR data matches the data onpresented in the ‘ASPAnalyse School Performance and ‘Compare schoolSchool and collegeCollege performancePerformance in England’ sites.sites? If the IDSR data matches what has been published, then please contact the DfE. If your questionquery isrelates aboutto bespoke calculations that are only used in the IDSR, for example percentile ranks, please email the IDSR team. Weand we will aim to respond as soon as possible.
LinkPredecessor to a predecessor or successor schoollink
TheIf applicable, the Ofsted IDSR service will provide a link to a predecessor (or successor) schoolprovider to view. Some schoolsproviders with a predecessor will not have a link. This is because we decided not to include predecessorpredecessors schoolswhere if there was no data on them.the predecessor school.
School details and release information
The informationschool ondetails theinformation school at the beginning of the report comes from the DfE’s Get‘Get information about schools (GIAS))’ service. This data is correct as of the release date on the IDSR.
Report information
The Ofsted IDSR will always show which release of performance data the report is based on. It will also show the date that the report was last released.
School
For characteristicsexample:
DataRelease source:information: Provisional 2023 Phonics, Final 2023 KS1, Revised 2023 KS2, Revised 2023 KS4, Revised 2023 16 to 18
Release date: 06 March 2024
Trust information
This expandable section provides information about the DfEtrust to which the school belongs. Only schools that are part of a multi-academy trust (MAT’s) Januarywill get this section of the report.
It will have information about the number of schools in the trust and the latest overall effectiveness grades of the schools within the trusts.
The grade profile of schools within a MAT will display the judgements a school censushas received under its current URN. It will display the latest inspection outcome, which could be either graded or ungraded. If a school received a grade before joining the MAT, then the school will be counted in the ‘not yet inspected’ section until it is inspected as part of the MAT.
The information in this section comes from the Department for 2024,Education’s 2023Get andInformation 2022.About Schools data, apart from the overall effectiveness which is Ofsted data.
School and local context
School characteristics
The chart shows school-level informationinformation, forbased on the lastannual 3January years.school census, for 2021, 2022 and 2023. If a school has a sixth form, a separate row will appear that shows informationthe context for Years 12, 13 and,and 14, where applicable, 14.applicable.
The chart contains the following measures:
-
the number of pupils on roll
-
the percentage of pupils receiving
inreceiptof)TheseatarethepupilstimewhooftheJanuarycensus;thesepupilsthosehavewhoare/have11);– referred to as FSM6; FSM data is not collected for sixth forms -
the percentage of pupils with special educational needs (SEN
SEND) support: those pupils who receive SEN support but who do not have an education, health and care (EHC) plan(SENDsupport) -
the percentage of pupils with SEN
SENDandSENDor an EHC plan -
the percentage of pupils whose first language is not English or is believed to be other than English
-
the stability percentage for the school
-
the school deprivation level
-
the pupil deprivation level
For each measure, theschool school’s figures will show for each year. TextThe andquintile shadingboxes arecompare usedthe latest year to showthe whichnational quintiledistribution thefor schoolall sitsschools. withinText inand shading are displayed depending on what quintile the nationalschool’s distributionvalue ofresides schools:in:
-
well above average (blue shading)
-
above average
-
close to average
-
below average
-
well below average (orange shading)
Special schools are compared with secondary school national values.
Except for the school location deprivation measure, schools are compared with other schools in the samenational by phase: primary (or middle deemed primary) or secondary (or middle deemed secondary).
Stability is a measure of the percentage of students who were admitted to the school at the standard time of admission. The stability percentage is calculated by dividing the number of pupils who meet the stability criteria by the number of all eligible pupils (pupils in Years 1 to 11 with a single or main dual registration at the school at the time of the January school census). The stability measure is not available for school sixth forms.
A pupil is counted as stable if they joined the school:they:
-
joinedtheschool -
joinedtheschooltheyear group had also joined the school -
joinedtheschool -
joinedtheschool
The school deprivation level is about the level of deprivation in the school’s local area.area in which the school is situated. The pupil deprivation level isshows aggregated information about the deprivation of pupils who attend the school. Each deprivation indicator is based on the income deprivation affecting children index (IDACI). The IDACI is based on 2019 English indicesIndices of deprivation.Deprivation.
The IDACI measures the proportion of all children aged 0 to 15 living in income-deprived families. It is a subset of the income-deprivationincome deprivation domain, which measures the proportion of the population in an area experiencing deprivation relating to low income. The definition of ‘low income’ we use includes both those people who are out of work and those who are in work but who have low earnings and who satisfy the respective means tests.
Information about a school’s local area is based on the 2011 lower layer super output area (LSOA) thatin which it fallsresides. within. LSOAs are geographicala areasgeographic hierarchy designed to improve the reporting of statistics on small areasarea statistics in England and Wales. They arecomprise made up of between 400 and 1,200 households and have a populationusually ofresident population between 1,000 and 3,000 people.persons.
You can read further information about the data used for the local area deprivation.
ForSentences 16-below to 18-year-olds (where applicable), the DfEtable useswill differenthighlight ruleswhere toa allocate students to the different measures. The year group characteristicsis aremarkedly baseddifferent onfrom the censusothers data, so there may be students who were no longer on roll as at the January 2024 census but are still allocated to the provider for accountability purposes.
Year group characteristics
Data source: the DfE’sfollowing January school census for 2024.measures:
The year group characteristics table shows information on the characteristics
percentageof the pupils in eachreceiptyearofgroup.FSMThisatsection will appear for all schools that submit a January school census return to the DfE.The
timetable presents data on pupils who were recorded as part of the DfE’s January schoolcensus;census.theseThis means the data for each year group is about the pupils who were in that year group last academic year.The measures included in the table are:
-
the number of pupils on roll
-
the percentage of pupils receiving FSM. These are pupils
thosewho are or have been eligible for FSM and have claimed them some time in the last 6 years (Reception to Year 11) – referred to as FSM6; FSM data is not collected for sixth forms -
the percentage of pupils whose
whofirstspeaklanguage is not English orasisanbelievedadditionalto be other than Englishlanguage
No
Informationhighlighting is appliedbasedtoonthisthetable;2023figuresJanuaryareschoolpresented for information only.census.For 16-
16to 18-year-olds18(where applicable),therearedifferentrulesthatthatwereareno longer on roll as at the DfE’s January school census but are still allocated to the provider for accountability purposes.Prior attainment
EthnicityData
Ethnicitysource:informationthecomesDfE’sfromJanuary school census for 2024.The prior attainment table shows how the school’s pupils performed at the previous key stage compared with all pupils in that year group nationally.
This section will only appear for schools with year groups in the secondary age range (Years 7 to 11 inclusive). This is because there is limited prior attainment data available for other year groups.
The table presents data on pupils who were recorded as part of the DfE’s January
2023The data
chartcontentdisplaysofthosetheethnictable focuses on the performance of these secondary-age pupils in their key stage 2 assessments:-
the pupils who were in Years 7, 8, and 11 in the latest year’s data sat assessments when they were in key stage 2. The data for these year groups is
withinbased on the proportionschoolofthattherepresentschool’s5%pupils who achieved the expected standard at key stage 2. -
the pupils who were in Years 9 and 10 in the latest year’s data did not sit assessments when they were in key stage 2 because of the COVID-19 pandemic. As such, no prior attainment data is available.
Shading indicates whether the proportion of the school’s pupils who achieved the expected standard at key stage 2 was above or below
morethe national proportion. The shading appears if the school value is at least 1 standard deviation away from the national value. If the proportion was in line with the national value, the text ‘Close to national’ is displayed. If the number of pupils in the cohortoverallwas 10 or below, the text ‘Small cohort’ is displayed.cohort.Ethnicity
Data source: the DfE’s January school census for 2024.
The chart displays the ethnic groups within the whole school. There are 17 possible ethnic groups:
-
White British
-
White Irish
-
White Traveller of Irish Heritage
-
White Gypsy/Roma
-
White Any other White background
-
Mixed White and Black Caribbean
-
Mixed White and Black African
-
Mixed White and Asian
-
Mixed Any other Mixed background
-
Asian or Asian British Indian
-
Asian or Asian British Pakistani
-
Asian or Asian British Bangladeshi
-
Asian or Asian British Any other Asian background
-
Black or Black British Caribbean
-
Black or Black British African
-
Black or Black British Any other Black background
-
Chinese
For this section, ‘Any other ethnic group’, ‘Parent/pupil preferred not to say’ and ‘Ethnicity not known’ are included.
included,somayappearinthetop5largestgroups.The corresponding national value for each group is displayed.
displayedonitsrespectivebar.If
Barsaredisplayedforwholeanda sixth form,forma(whereseparateapplicable).PriorethnicityattainmentThechartpriorwillattainmentbetabledisplayed.presentshowpupilsinschoolperformedatthepreviouskeystageinrelationtotheiryeargroup.SEN
Forcharacteristics2023priorattainment:Data
theresource:isnopriorattainmentdataforYears8and9becauseofCOVID-19Januarypandemicitschooliscensusbasedonthoseachievingtheexpectedstandardatkeystage2Years7,1011
Shadingindicateswhetherthepupilsinthisschoolwereaboveorbelownational.Thisistriggerediftheschoolvalueis1or2standarddeviationsfromthenationalvalue.Ifpupilswereinlinewiththenationalvalue,adashisshown.Ifthenumberofpupilswas10orbelow,an‘X’isshown.Therewasnodataavailablefor16to18priorattainmentin2022.Thisisbecausethesepupilsdidnottakekeystage4examsin2020,becauseoftheCOVID-19pandemic.PriorattainmentforYears1to6arenolongerdisplayedintheIDSR.service.Thisisduetoalackofdatain2023andinfutureyears.SENDcharacteristicsThe
January2023censusprovidesdataforthistable.TheSENDand what the primary need category is. The 2 halves of the table represent pupils who have SENSENDsupport and pupils who have an EHC plan.It also shows what year the pupil is in. The text
sectionabove the tables displays if the school has any resourced provision. This could be a SENSENDunit, resourced provision or both. The capacity representswillrepresentspecialeducationalneedSENDhave receivedbeeninreceiptofSEN
SENDunits are special provisions within a mainstream schoolschool.whereThesetheunitspupilscontainwith SEN are taught within separate classes fortoatteachleastpupilshalfwithofSEND.theirThesetime. Units:units:-
are
receivedesignatedextrabyfundingfrom -
receive funding per place, and usually top-up funding for any additional costs of support required by individual pupils
-
cater for a specific type or types of SEN
SEND(for exampleexample,autistic spectrum disorder)disorders) -
are usually for pupils with an
statementsorplans(but maythisalsoisprovidenotsupport for pupils with SEN support)required)
Schools
Resourcedshouldprovisiononlyrefersusetothis indicator where the SEN unit has been formally recognised as such by the local authority where the school is located.Resourced provisions are places that are reserved at a mainstream school for
specificSEND,.taughtTheforpupilsatlearnleast half of their time within mainstream classes,classesbut requiringrequirea base and some specialist facilities around the school.facilities.Resourced provisions:
provision:-
are
receivesdesignatedextrabyfundingfrom -
receive
catersfunding per place, and usually top-up funding for any additional costs of support required by individual pupils -
cater for a specific area
typeor areastypesof SEN,(forforexample specific learning difficulties)difficulties -
are
isusually for pupils with anstatementsorplans,but couldthisincludeispupilsnotwith SEN supportrequired
The capacity of the SEN unit and/or resourced provision
provision,willcapacityalsoandbe displayed alongside the type of SEN provision.Schools should only use this indicator where the resourced provision has
informationbeencomesformally recognised as such by the local authority where the school is located.Most pupils placed in units will have an EHC plan. It is unlikely that a child would be placed in a unit and also receive support from resourced provision, but a school could have resourced provision for one type of need and a unit for another.
The trust
Data source: the Ofsted inspection outcome data and the DfE’s GIAS service as at the month of the release.
service.This
Thesectioncapacityprovides information about the multi-academy trust (MAT) that the school belongs to. It only applies to schools that are part of a MAT.It will have information about the number of schools in the trust and their latest inspection outcomes. Schools inspected in the academic year 2024/25 will not receive an overall effectiveness grade.
The grade profile of schools within a MAT
SENDwillunitdisplayand/ortheresourcedoutcomesprovisionthat schools have received under their current URNs. It will bealsosplit into 2 sections:-
schools last inspected before September 2024
-
schools inspected from September 2024 onwards
In both instances, the latest inspection outcome, which could relate to either a graded or ungraded inspection, will be displayed.
displayedIfalongsidea school’s grade was received before it joined the MAT,typethe school will be counted in the ‘not yet received graded or ungraded inspection’ group until it is inspected as part of the MATSEN.provision.Staffing
Data source: the Education and Skills Funding Agency’s 2022/23 ‘view my financial insights’ data, and the DfE’s November 2023, 2022, 2021 and 2020 school workforce census data
The staffing section of the IDSR presents information on several areas relating to staffing.
The proportion of education support staff relative to teaching staff
This sentence
isbasedondatafromtheDepartmentforEducation’sSchoolWorkforceCensus(November2022).ItExample sentence
The proportion of education support staff relative to teaching staff was in the lowest 20% of all schools in 2023,
2022,20222021and 2021.2020.Per-pupil spending on staff-related areas
This sentence highlights areas of high and low spending
expenditurein the latest year, when compared with similar schools, inrelatingtostaffing-relatedareas:-
agency supply teaching staff
-
education support staff
-
educational consultancy
-
staff development and training
-
supply teaching staff
-
teaching staff
Example sentence
Per-pupil
Perpupil2021/22for: education support staff.Spending
Expenditureon teaching staff includes:-
costs for teachers employed directly by the school, including supernumerary/peripatetic teachers on short-term contracts
-
all contracted full-time and part-time teachers paid within the scope of the Education Act 2002
-
gross pay, including allowances, maternity pay and the employer’s contributions to national insurance and teachers’ pensions
-
teaching and learning responsibilities
(TLR)
It excludes:
-
any teachers employed casually and directly, for example supply teachers
-
any teachers not employed directly by the school, for example agency staff
Spending
Expenditureon salaries and wages for supply teachersteachingstaffpayincluding allowances, maternity pay and the employer’s contributions to national insurance and pensions.superannuation.This applies to staff employed directly by the school who are covering:
coveringabsencefor:-
curriculum release absence
-
long-term absence
-
sickness absence
-
training absence
It excludes supply teachers who are not employed directly by the school (that is, who are paid through an agency or another third party), regardless of the period of cover.
Spending
Expenditureon agency supply teaching staff relates to the money paid to an agency for teachersteachingwhostaffthatThis includes cover of any period and for all reasons,
reasonsincluding illness,absenceforanyIt excludes supply teachers employed directly by the school.
Spending:
Expenditure:similar schools comparatorBy default, schools are compared with
againstthe 30 schools most statistically similar in the same sector (academy or maintained).Thesearebasedonpupilcharacteristics.30,ThewiththeThe 30 default schools that make up this comparator group are
havebeen-
school phase or type
-
region
-
boarding or non-boarding type
-
number of pupils
-
percentage of pupils eligible for FSM
freeschoolmeals -
percentage of pupils with SEN
SEND, or proportion of various SENSENDprovisions for special schools
Teacher absence
A sentence gives
showsthe percentage of teachers with at least 1 period of sickness absence comparedversuswith the national rate for the latest 32years.Another sentence reports on the average number of days lost to teacher sickness absence in the latest year only.
Example sentences
-
The percentage of teachers with at least 1 period of sickness absence was significantly above national in 2022/23.
2021/22. -
2 days on average were lost to teacher sickness absence in 2022/23.
2021/22.This was in the lowest 20% nationally.
Sickness absence data collected in the November 2021 census relating to the 2020/21 year was
isaffected by the COVID-19 pandemic.It is not possible to draw accurate comparisons with previous
timedueof,toforfactorsexample,includingpartiallydeliveryteachingofeducationthroughvirtualmeanscases,andpotentialrecordingofabsence.was recorded. The figures relate to sickness absence only and do not include non-attendance due to, for example, isolation and shielding.Data on school workforce attendance during the pandemic has been collected through the DfE’s education settings survey.
Staff retention
Example sentences
-
At the time of the November 2023
2021census, there was 1 full-time vacant teacher post in the school. -
Staff turnover was in the highest
lowest20% in: 2022,in2021.2019.
Information on staff turnover
asatthe2021schoolworkforcecensusfulltimewillconsideredbetohighlightedhaveashavingtheturnover rate was in the highest 20% in any of the previouslatest3 years. Low staff turnover is not highlighted. Special schools are compared with primaries.Turnover
ItisworthnotingthatturnoverFurther,whenturnoverit is important to considerbeconsciousofsizebecause this has a big impact on rates, particularly for small schools.Absence
School
Data
Thesource: the DfE’s 2023/24published(1schoolterm),workforce2022/23information(3providesterm)dataandfor2021/22the(3vacantterm)postacademicmeasuresyearasdata.atNovember2022.This
ThesectionDfEcontainsalsotablessuppliesshowingthewhenstaffaturnoverschool’ssourcepercentagedata.LinkstoalternativeprovisionandotherprovidersThissectiontheorIDSRpersistentprovidesabsenteesinformationwasaboutinlinksthe highestschoolorhaslowestwith20%othertypesprovision,schoolsincludingoralternativeofprovision.Thesimilarfirstschools.sentenceSimilarshowsmeanshowthemanysamepupilsphase(whereofapplicable)educationmovedintostate-fundedalternativeprovisionwhetheratheysimilarremainedlevelthere.ExampleofsentenceSincedeprivationJanuary(in2021,the9samepupilsIDACIhavequintile).movedSpecialintoschoolsstate-fundedarealternativecomparedprovisionwithfromthisschool.AllpupilswerestillinapupilreferralunitattimevalueofforthesecondaryJanuaryschools.2023census.Absence
Thisissectionthealsoaggregatedprovidestotalinformationofaboutallotherauthorisedschoolsand unauthorisedalternativeabsences.provisionAproviderspupilthatispupilsidentifiedinasthisaschoolpersistentwereabsenteedualifregisteredtheyatmissaccording10%toorthemoreJanuaryof2022theircensus.possibleThesessions.Local
numberauthorityData
ofsource:pupilsatschool2024/25ispupilshownattendance in schoolsbrackets.Exampledata.sentenceThis
AccordingsectiontocontainstheaJanuarytable2023showingcensus,absencepupilsdata,atforthistheschoolcurrentwereacademicalsoyear,registeredforatthe localfollowingauthorityproviders:Primaryin–whichSchooltheAschool–isURNlocated.XXXXXXThe(1)
AbsenceAbsenceAbsenceIDSRdatawillisdisplay,basedon3terms2022/23sameandphaseforas2021/22.theAschool,tabletheshowslocalwhenauthority’stheschoolorpersistentabsenteeswasinhighestacademicoryearlowestand20%for theallmostschoolsrecentorweekforaboutsimilarwhichschools.weSimilarholdmeansdata.theThesametablephasewillofalsoeducationshowandwhenwiththeseaaresimilarinleveltheofhighestdeprivationor(inlowestthe20%sameforIDACIall localquintile).authorities. Special schools are compared with the national value for secondary schools.Absenceistheaggregatedtotalofallauthorisedandunauthorisedabsences.Apupilenrolmentisidentifiedasapersistentabsenteeiftheymiss10%ormoreoftheirpossiblesessions.Suspensions and permanent exclusions
Whole school
Data
Servicesource:children’stheeducationDfEproviderIDSRs’s 2022/23,only2021/22havesuspensionspermanentexclusionsdataforthelatestavailable.The whole school measure includes all year groups in the school.
WholeschoolThis section contains
istablesdivideddisplayinginto2parts:Atableprovidingschoolnumberpercentageof suspensions, pupils with 1 or more suspensions,suspensionsandsuspensions.Supportingsentencesabout2or more suspensionssuspensions,reasonsforsuspensions,andexclusions. It also contains the reasons for suspensions and permanent exclusionsexclusions,inwheretheapplicable.latestExampleyear.Up
sentencesto 3 reasons can be recorded. These reasons are recordedshownwithoutbelow.
Theweightingtableordisplaysprioritisation. As such, the totalschoolnumberpercentageof reasons may exceed the total number of suspensions or permanent exclusions.The tables for pupils with 1 or more suspensions and pupils with 2 or more suspensions
suspensions,alsowhichdisplayarethe percentage for the school. This is calculated by dividing the number of pupils suspended by the number on roll. These percentages have been calculated for the last 3 years and are displayed in the ‘School %’ row of the table. For each year of data, we have also profiled the school’s suspensions against national comparators, indicating whether the school is in the highest 20%. This is represented in the following rows of the table:-
‘Comparison to all schools’ – this profiles the school against all schools in
withthe same phase of education. Special schools are compared with the national rate for secondary schoolsschools. -
‘Comparison to all schools with a similar level of deprivation’ – this profiles the school against all schools with the same phase of education and with a similar level of deprivation (in the same quintile for the income deprivation affecting children index (IDACI)). This row will not be visible for primary schools – we do not produce the comparison because
dueprimarytoschools have very low suspension ratesrates.
The number of pupils who
withhaveabeenpermanentpermanentlyexclusionexcluded is provided for up to the last 3 years. The national average, profiled by phase of education, is alsoincludedincluded.forthelatestyear.averagefor secondaryspecialschools.The numbers and proportions of pupils with suspensions or permanent exclusions are often very small. These should be interpreted with caution, particularly when making comparisons over time. The
Additionally,datatheonCOVID-19pandemicstartedduringthe2019/20reportingperiod.Weareawarethatratesofgenerallydroppedduringthisyearasaresult.ThesuspensionsandpermanentexclusionsdataForexample,2019/20datawaspublishedinJuly2021.Suspensionsandpermanentexclusionsdatacohortscohort before the one shown on the context page,pageand the number on roll may have changed.Further information on pupil exclusion statistics is in the DfE’s pupil exclusion statistics methodology publication.
16 to 18
SuspensionsData
Forsource:schoolswithatleast1pupilwithasuspensionin2021/22,asentencedetailsprevalence2022/23,of2021/22repeatsuspensions.Forschoolswithbetween110academicpupilsyearreceivingdata.asuspension,thesentencestateshowmanyreceivedmorethan1.Ifanypupilsreceivedmorethan1,thesentencealsostateshowmanyreceived10ormore.Thesameappliestoschoolswithmorethan10pupilsreceivingasuspension.However,thesentencequotesproportionsratherthannumbersofpupils.16
ExampletosentencesOf18the7pupilswith1ormoresuspensions2021/22,section4relatesweretosuspendedYearson12,213ormoreoccasions1wherereceivedapplicable.10ormoresuspensionsduringtheyear.This
Ofsectionthecontains56tablespupilsdisplayingwithinformation1aboutormoresuspensionsin2021/22,34%weresuspendedon2ormoreoccasionsand10.7%received10ormoresuspensionsduringyear.Fornumberschoolsofwithsuspensions,atpupilsleast1pupilinthe2021/22,totalasentencestatesthesuspensionsexclusions.andItanyalsoreasonscontainsaccountingfor10%ormoreofschool’ssuspensions,withtheirfrequency.ExamplesentenceOfthe13suspensionsin2021/22,thefollowingeachaccountedmoreandthan10%:verbalabuse/threateningbehaviouragainstapupil(5),racistabuse(3),physicalassaultagainstanadult(2).PermanentexclusionsAsentenceappearsforeachschoolstatingthenumberofeachoflast3years,ifdataisavailable.Thesentenceincludesthenationalaveragefortheyear,profiledbyphase.Up
ExamplesentenceTherewas1permanentexclusionin2021/22.Thenationalaverageforthisyearwasclosezero.reasonsTherecanwerebenonerecorded.inThese2020/21reasonsbutarethererecordedwerewithout2weightinginor2019/20.Forprioritisation.schoolsAswithsuch,atleast1pupilwhoreceivedapermanentexclusion,asentencestatespermanentexclusionsandtheforexceedthese,withtheirfrequency.ExamplesentenceOf2numberpermanentofexclusionsin2021/22,bothwerefortheft.16to1816to18inthissectionrelatestoYears12,13and14whereapplicable.Nationalaveragesforbothandpermanent exclusions.exclusionsareprofiledbyphase;specialschoolsarecomparedwiththesecondarynationalvalue.TheDfEsuppliesthesourcedataforthissection.SuspensionsDue to the low number of suspensions and permanent exclusions nationally in sixth forms, it has not been possible to make the same comparisons as with the whole school measure (highest 20%). Instead, we present
havepresentedthissame reason, the IDSR does not show sixth-form students with 2 or more suspensionsforsixthformscomparisonstoschoolssimilarlevelsofdeprivation.Asentencewillappearstatingthenumberofstudentsat16to18with1suspensionsandinit2021/22,doesifnottherecomparewereany.Thesentencewillalsostatenationaltoaverageschoolsnumberwithforsimilarthelevelslatestofyear.deprivation.Iftherewerealsosuspensionsin2020/21and2019/20,thisinformationwillalsobepresented.National
ExampleaveragessentenceThereforwereboth2studentsat16to18with1ormoreinpermanent2021/22.exclusionsThearenationalprofiledaveragebyforphase;thisspecialyearschoolswasare1.comparedTherewithwerealso2in2019/20butnonein2018/19.Subsequentsentenceswillappearthatstatereasonnationalforvalue.thesuspension(s)in2021/22.Further
ExampleinformationsentenceOfonthepupil2exclusionsuspensionsstatisticsatis16to182021/22,followingreasonseachaccountedformorethan10%:physicalassaultagainsta(1),statisticsphysicalmethodologyassaultpublication.againstanadult(1).Pupil
PermanentmovementexclusionsData
Asource:sentencemovementappearsbetweenforeachschoolstatingnumberJanuaryofschoolpermanentcensusesexclusionsforin2022eachandof2023,theaslastwell3asyears,2021ifanddata2022.isavailable.Thesentenceincludesthenationalaverageforthelatestyear.We
ExamplehavesentenceThereusedwaspupil-level1datapermanentfromexclusiontheatDfE’s16Januarytoschool18censusinto2021/22.identifyThepupilsnationalwhoaverageforthisyearwas1.Therealso32020/21givenandyear2in each2019/20.ForschoolschoolsinwithJanuaryatleast1pupilwhoreceivedapermanentexclusion,asentencestatesthetotalnumberpermanentyear,exclusionsand whetherthetheyreasonswereforstillthese,inwiththeirfrequency.ExamplesentenceOf2schoolpermanentexclusionsat16to182021/22,ofboththewerefollowingforyear.unspecifiedreasons.PupilmovementThe pupil movement section presents 2 different measures of pupil movement:
-
pupils who were present in Year 10 in the first school census, but not in Year 11 in the second,
secondcensus, -
pupils who were present in the first school census in Years 7, 8, 9 or 10, but did not appear in the second,
secondcensus,
Wehaveusedpupil-leveldatafromtheDfE’sspringschoolcensustoidentifypupilswhowereinagivenyearineachschoolinJanuaryof1year,andwhethertheywerestillinthesameschoolinJanuaryofthefollowingyear.The pupil movement section of the IDSR only covers pupil movement for secondary Years 7, 8, 9 or 10.
We do not use the census data from other school terms for this analysis, for example the autumn term census. This may mean that the figures do not match those produced by some schools or local authorities.
We developed a logistic multi-level model that uses contextual factors to estimate the
whatproportion of pupils that we might expect to leave each school. This is for movements between Years 10 and 11 only. Our analysis shows that these contextual factors are associated with higher levels of pupil movement. The contextual factors that the model takes into account are pupils’ and schools’ characteristics. Pupil movement between Years 10 and 11 may be highlighted as ‘significant’ if pupil movement was higher than estimated by the model.The following are the pupils’ characteristics:
-
gender
-
eligibility for FSM
freeschoolmeals -
speaking English as an additional language
-
key stage 2 attainment (low, middle, high or not present in key stage 2)
-
having SEN
SEND, especially social, emotional or mental health issues -
being in either the White Irish Traveller or White Roma ethnic group
-
being looked after by a local authority
-
IDACI of home postcode
The model also takes into account whether the school area is urban.
This section of the IDSR also provides information about pupils who have left the school and then do not appear in the subsequent DfE January school census in one of the following school types:
-
maintained nursery
-
primary
-
middle deemed primary
-
middle deemed secondary
-
secondary
-
all-through
-
special schools (including non-maintained special schools)
-
pupil referral units/alternative provision
(PRU/AP) -
academies (including free schools, university technical colleges
(UTCs) -
city technology colleges
(CTCs)
There are destinations outside of the census that the pupil may have moved to, which the
schoolsschool may have information about that they can share with inspectors.Links
Progressto alternative provision and otherattainmentprovidersData
atsource:keythestagesDfE’s1summer term 2024 alternative placements data.The table shows information about alternative provision placements. This section will appear for all schools that submitted information on alternative provision placements in the latest data.
The placements include alternative provision, companies, providers registered with the UK Register of Learning Providers, further education and other schools.
The total number of pupils is shown, as well as the number of pupils attending full time and part time. Numbers in brackets are additional pupils who were attending the alternative provision but left during the census period.
Example
URN UKPRN Companies House number Postcode Provider type Provider name Total pupils Full time Part time 123456 - - AB1 2AB Free Schools Alternative Provision Example Academy 4 (2) 2 (1) 2 (1) In the example school above, 6 pupils in total were placed at the alternative provision; 3 of these were part time and 3 were full time. However, the total pupils column shows that 4 pupils remained in the placement at the end of the census period, with 2 having left during the census period. The final
‘progress2 columns show that 1 full-time pupil and 1attainmentpart-time pupil left during the period.Attainment in phonics and at key stage
stages2Data
1source: the DfE’s provisional 2024, final 2023 and final2’2022 data.The table displays where measures are significantly above or below the
national,national value, alongside the associated percentile. The cohort, school value and national value are also displayed.Arrows indicate whether the school’s
schoolvalue, when compared with the national value, has changed. A dark shaded upward arrow indicates that theschoolfromthe school’s value and the national value has increasedimprovedsincefromthe comparator year (a(differencedifference of at least 2 standard deviations). AnAupward arrow in a lighter shadeupwardarrowschoolfromthe school’s value and the national value has increasedimprovedslightly sincefromthe comparator year (difference of at least 1 standard deviation). Arrows pointing downwards indicate that the difference betweentothe school’s value and the national value has decreased,becomeworse,schoolbetween the school’s value and the national value is similar to the difference between its value and the national value in the comparator year (the(differencedifference was less than 1 standard deviation or there were 10 or fewer pupils).Inthe‘1year’columnwecompare2023and2022data.Inthe‘4year’columnwecompare2023and2019.A standard deviation is a measure of how dispersed the data is in relation to the mean. A
Low,smallorsmall,mean,and ahigh,largeorlarge,The following measures are contained in this section:
-
phonics Year 1 meeting the expected standard
-
key stage
1readingmeetingtheexpectedstandard keystage1writingmeetingtheexpectedstandardkeystage1mathematicsmeetingtheexpectedstandardkeystageprogresskeystage2writingprogresskeystage2mathematicsprogresskeystage2reading-
key stage 2 reading achieving the higher standard
-
key stage 2 writing meeting the expected standard
-
key stage 2 writing achieving greater depth
-
key stage 2 mathematics meeting the expected standard
-
key stage 2 mathematics achieving the higher standard
-
key stage 2 reading, writing and mathematics
(RWM) -
key stage 2 English grammar, punctuation and spelling (EGPS) meeting the expected standard
-
key stage 2 EGPS achieving the higher standard
-
key stage 2 multiplication tables check (MTC)
Additional
PleasesentencesnotewillforbeMTCdisplayedmeasurebelowittheistablenotaboutpossibletocompareperformanceagainst2019becauseassessmentonlybecamestatutory2022.Hence‘4screeningyear’checkcolumnwillshow ‘nodata’allYearschools1forandthisYearmeasure.Additional2sentencespupilswill(whereberelevant).displayedThebelowsentencestheshow:tableshowing:-
the total number of pupils
Yearwho1werephonicseligiblepupilstoandbe screened for phonics -
how many of them sat
didthenotcheckmeet(andthehowexpectedmanystandard.didWherenot,thewherenumberapplicable) -
details of how many pupils
whoisapplicable) -
greaterthan10,thoseisdidgiven.notThemeetsentencethealsoexpectedprovidesstandarddetails(whereofthehownumbermanypupilsdidsitthe standardtest,waswheregreater than 10)applicable.
Example
thesentenceThere
totalwerenumber59ofpupilsYearwho2were eligible for the phonics screeningpupilscheckandinhowYearmany1 in 2024; 54 of them satdidmeetexpectedandstandard.Example5 did not.sentenceOf those
thewho63satyearthe1check,pupils,1512pupils did not meet the phonics expected standard;standard,theirwithanof21.23,and8didnotsitthetest.17pupilspupil(s)whothatwere eligiblescreenedfor the phonics screening check in Yearyear2 in 2024;2023;1214of them sat the check and 6 did not. Of those whometsat the check, 3 pupils did not meet the phonics expected standard.The number
initialreleasethewhoIDSRdidwillnot sitincludethe phonicsMTCscreeningdatasetcheckasincludesthis(whereisapplicable)receivedthelaternumberthanwhootherwereprimaryabsent, the number who were disapplied, and the number where there was maladministration.measures.You can find more information on the accountability measures in this DfE guidance document:
Subject
Keyentries at key stage 4subjectsData source: the DfE’s final 2023, final 2022 and final 2021 data.
English Baccalaureate entry
The English Baccalaureate (EBacc) is a set of subjects at GCSE that keeps young people’s options open for further study and future careers. The EBacc consists
requiresofpupilstohavestudiedThe EBacc entry data is calculated using early entry and discounting rules. This means that pupils who entered EBacc subjects in the
2022previous year will have those entries counted towards their EBacc entry rate in the latest year.2023.The
Asentence belowiswillshownappear for every school wheretherewerepupils.reached the end of key stage 4 in the latest year. This describes the EBacc entry rate for the school in the2023.latestAnotheryear. It may be followed by another sentence thatshowsdetails the subject cluster with the lowest rate of EBacc entry (if the entry rate foristhat cluster was below 75%). This could beeitherExample sentence
The EBacc entry rate in this school in 2023 was 52%. Languages had the lowest entry rate of EBacc subject areas (56%).
Subject entries table
atkeystage4This section shows the subjects that this school entered for in the
2023,latest20223 years and the2021.number of entries for each. It also highlights if the school had a high or low average point score in a particular subject compared withtoother schools, where applicable.The entries figure represents the number of exam entries
inagivensubject,qualificationin 2 different exam seasons, this would count as 2 entriesentries.in the academic year when they finished their key stage 4 study. As an example, imagine a pupil who was entered for GCSE English literature when they were in Year 10, then was entered again for GCSE English literature when they were in Year 11 in the latest year. This would count as 2 entries into English literature GCSE in the latest performance year. Discounting has not been applied to this table and it includes entries that may not have counted in performance measures. Early entries were not included in 2021.The purple shading is darker where there was a greater number of entries. Subjects are grouped by EBacc
,and sector subject area,areaand then listed alphabetically by subject. EBacc subjects are presented at the top by default. The sector subject areas are based on those listed in the qualification descriptions.A shaded box and corresponding text will appear if the average point score for pupils in a particular subject is in the highest or lowest 20% of all schools and only if entry levels were at or above national entries. Cohorts of 10 or fewer will not be highlighted.
Qualification type is also included, which covers the following:
-
AS
-
EBacc AS
-
EBacc GCSE
-
EBacc level
L1/L21/level 2 certificatecert -
free-standing
Free-StandingmathsMathslevel 3 -
GCSE
-
graded
Gradedmusic -
level
L1/L21/level 2 certificatecert -
level
Level1 -
level
Level1/2 -
level
Level2 -
other
Otherat level 1 -
other
Otherat level 2
Please note that for technical awards, any entries for a level 1 qualification may be grouped with those for the level 2 qualification in the same subject. Such figures will be represented as a single row where the ‘Qualification type’ is listed as ‘Level 1/2.’
The cohorts above the section represent total pupils at the end of key stage 4.
Progress and attainment at key stage 4
Data source: the DfE’s final 2023, final 2022 and final 2019 data.
The ‘progress and attainment at key stage 4’ table displays where measures are significantly above or below the national value, alongside the associated percentile. The cohort, value and national value are also displayed.
Arrows indicate whether the school’s
schoolvalue, when compared with the national value, has changed. A dark shaded upward arrow indicates that theschoolfromthe school’s value and the national value has increasedimprovedsincefromthe comparator year (a(differencedifference of at least 2 standard deviations). AnAupward arrow in a lighter shade indicatesupwardthatarrowtheindicatesdifference between the school’sschoolvaluedifferenceandfromthe national value has increasedimprovedslightly sincefromthe comparator year (a(differencedifference of at least 1 standard deviation). Arrows pointing downwards indicate that the difference betweentothe school’s value and the national value has decreased,becomeworse,schoolbetween the school’s value and the national value is similar to the difference between its value and the national value in the comparator year (the(differencedifference was less than 1 standard deviation or there were 10 or fewer pupils).Inthe‘1year’columnwecompare2023and2022data.Inthe‘4year’columnwecompare2023and2019.A standard deviation is a measure of how dispersed the data is in relation to the mean. Low, or small, standard deviation indicates data is clustered tightly around the mean, and high, or large, standard deviation indicates data is more spread out.
The following measures are contained in this section:
-
overall
OverallProgress 8 -
English element of Progress 8
-
mathematics
Mathematicselement of Progress 8 -
EBacc element of Progress 8
-
open
Openelement of Progress 8 -
overall
OverallAttainment 8 -
English element of Attainment 8
-
mathematics
Mathematicselement of Attainment 8 -
EBacc element of Attainment 8
-
open
Openelement of Attainment 8 -
science
Sciencevalue added -
languages
Languagesvalue added -
humanities
Humanitiesvalue added -
English
Science% at grade 4 or above/grade 5 or above -
mathematics
Languages% at grade 4 or above/grade 5 or above -
science
Humanities% at grade 4 or above/grade 5 or above -
languages % at grade 4 or above/grade 5 or above
-
humanities % at grade 4 or above/grade 5 or above
You can find more information on the accountability measures in this DfE guidance document:
Secondary accountability measures (including Progress 8 and Attainment 8)
Destinations after
atkey stage 4 (2021 leavers)Data source: the DfE’s revised 2020/21, revised 2019/20 and revised 2018/19 data.
This table displays the proportion of pupils who
thatcontinued to complete specified destinations. This data is publicly available and comes from the DfE’s destinations collection.The destination
datainformationforinthethislatestsectionyearrelates to the pupils who were‘sustaineddestinations’2021/22.stageThis4means2thoseyears before the pupils towhowhichreachedthe latestendperformanceofdatakeyinstagethe4IDSRinrelates,2020/21.andThewhorowhaveheadersustaineddisplaystheirthedestinationyearforof6completedmonthseducationafterascompletingthekeylateststageyear.For4.aInformationdestinationontocount,mustthe same cohort who did not sustain theirparticipationdestination for 6amonths6-monthis also presented alongside the category where no activity beyond key stage 4 was captured.period.Blue boxes
willwillwhena figure was, statistically, significantly below the national average.If data has been suppressed because
duethetocohortsmallwascohorts,small, then ‘small cohort’ will be shown in the table. ThisCohortsuppressioninthistableA
Serviceseparatechildren’stableeducationwillproviderbe presented for disadvantaged pupils. The national figure in this table is the national average for all other pupils who are not disadvantaged. Disadvantaged pupils are those who were eligible for FSM at any time during the last 6 years and looked after children (in the care of the local authority for a day or more or who have been adopted from care).IDSRs for service children’s education providers will only have the destinations for the latest year due to data availability.
16 to 18 qualification types and retention
Data
Thesource qualification type:typethetableDfE’sisfinalbased2023,onfinal 2022dataandforfinal2023.2019Thedata.Data
retentionsourcetableretention:isthebasedDfE’sonfinal 2023,datafinalfor2022 and final 2019 data.2023.Qualification types
This table displays the proportion of students undertaking each type of qualification.
Students may be working towards more than one type of qualification and so may be counted more than once. Students taking courses that are not full qualifications are not included. Students taking academic qualifications other than A levels are not included in the table under individual qualification types but are included in the cohort information. Therefore, the percentages may not add up to 100.
Below the table is a sentence that
whichappearsispresentedforthe proportion of students who have not takentakingany level 3 or level 2 DfE-approved qualification in the2023.latest year. This highlights when a school is in the highest or lowest 20% nationally for the latest year or the latest 2 years.A sentence will also be shown if the school is delivering T levels in 2023/24, as shown in published DfE data.
Retention on main study programmes
This section provides data on the extent to which a provider retained
retainsstudents to the end of the main learning aim of their study programmeprogramme.in the latest 3 years. The measure used in this section is ‘retainedretainedand assessed’.assessed.Students are counted in the retained and assessed measure if they are retained to the end of their course and are assessed. The assessment may not necessarily be in the same subject or type of qualification they were aiming for when their studies began. However, the assessment must be at the same level and at least the same size as the main aim. For example, a student with an original main aim of tech level at size 1 would be considered as retained and assessed with an applied general exam result of at least size 1.
Data is presented for 4 study programmes:
-
A levels (including AS level)
-
level 3 applied general
-
level 3 tech level
-
level 2 technical certificate
Since
From2019, only technical certificates havewillbeenberecognised as level 2 vocational qualifications in the 16 to 18 performance tables. In 2018, the DfE reported a broader range of qualifications. The DfE’s 16guidancetoon18technicalqualificationsandguidancevocationallistsqualificationsallcontainsthelistsof2019performance tables each year from 2018 to 2026. The DfE also publishes further guidance about 14 to 19 technical and applied qualifications.tables.A student’s study programme is defined based on their main aim. The DfE’s 16 to 18 accountability measures technical guide provides further information on how this is defined.
Subject entries at 16 to 18
Data source:
subjectsthe–DfE’slevelfinal 2023 and final 2022 data.3This section shows the subjects the school entered pupils for in
bythethislatestschool2inyears2023and the number of entries for each.2022.The entries figure represents the number of exam entries
inagivensubject,qualificationin 2 different exam seasons, this would count as 2 entriesentries.in the academic year when they finished their course of study. As an example, imagine a pupil who was entered for a technical certificate in business studies when they were in Year 12, then was entered again when they were in Year 13 in the latest year. This would count as 2 entries into the business studies technical certificate in the latest performance year. Discounting has not been applied to this table and this includes entries that may not have counted in performance measures.The purple shading is darker where there was a higher
greaternumber of entries. Subjects are grouped by subject cluster and listed alphabetically,alphabeticallyfirst by cluster then by subject.Qualification type is also included, which covers the following:
-
A level
-
applied single award
-
applied double award
-
pre-U principal
-
international baccalaureate
The cohorts above the section represent total students at the end of 16 to 18.
Progress
Attainmentand attainment at 16 to 18Data source: the DfE’s final 2023, final 2022 and final 2019 data.
The ‘attainment at 16 to 18’ table displays where measures are significantly above or below the national value alongside the associated percentile. The cohort, value and national value are also displayed.
Arrows indicate whether the school’s
schoolvalue, when compared withtothe national value, has changed. A dark shaded upward arrow indicates that theschoolfromthe school’s value and the national value has increasedimprovedsincefromthe comparator year (a(differencedifference of at least 2 standard deviations). AnAupward arrow in a lighter shade indicatesupwardthatarrowtheindicatesdifference between the school’sschoolvaluedifferenceandfromnational value has increasedimprovedslightly sincefromthe comparator year (a(differencedifference of at least 1 standard deviation). Arrows pointing downwards indicate that the difference betweentothe school’s value and national value has decreased,becomeworse,schoolbetween the school’s value and the national value is similar to the difference between its value and the national value in the comparator year (difference was less than 1 standard deviation or there were 10 or fewer pupils).Inthe‘1year’columnwecompare2023and2022data.Inthe‘4year’columnwecompare2023and2019.A standard deviation is a measure of how dispersed the data is in relation to the mean. Low, or small, standard deviation indicates that data is clustered tightly around the mean;
mean,andThe following measures are contained in this section:
-
A level average point score
-
tech
Techlevel average point score -
best
Best3 A levels average point score -
applied
Appliedgeneral average point score -
A level AAB %
Destinations after 16 to 18 (2021 leavers)
Data source: the DfE’s revised 2020/21, revised 2019/20, and revised 2018/19 data.
This table displays the proportion of students who completed their study programme at the provider who went on to sustained education or employment, who went on to a destination that was not sustained or whose activity was not captured. It further shows what proportion of all students went on to an apprenticeship, to any education and to higher education.
The destination
datainformationforinthethislatestsectionyearrelates to the 16pupilstowho18‘sustainedcohortdestinations’fromin22021/22.yearsThisbeforemeansthethosecohortpupilsaboutwhowhichreachedthe latestendperformanceofdatakeyinstagethe4IDSRinrelates,2020/21.andThewhorowhaveheadersustaineddisplaystheir destination for 6 months after completing 16 to 18 education. Information on pupils from the sameyearcohortofwhocompleteddideducationnotassustain their destination for 6 months is also presented alongside the categorylatestwhere no activity beyond 16 to 18 was captured.year.Blue boxes
willwillIf data has been suppressed because
duethetocohortsmallwascohorts,small, then ‘small cohort’ will be shown in the table. ThisCohortsuppressioninthistableA separate table will be presented for disadvantaged pupils. The national figure in this table is the national average for all other pupils who are not disadvantaged. Disadvantaged pupils are those who were eligible for FSM at any time during the last 6 years and looked after children (in the care of the local authority for a day or more or who have been adopted from care).
For the destinations, the DfE uses a flexible end year to determine which students are included in the measure. The DfE’s 16 to 18 accountability measures technical guide contains further information on the methodology.
This data is taken from the DfE source
‘Destinations of KS4 and 16 to 18 (KS5) students: 2022,’,which includes full definitions of the measures used and further breakdowns of the data.Pupil groups
Data
Pupilsource:groupthedifferencesDfE’s provisional 2024 (primary), final 2023 (secondary) and 2023/24 (1 term) absence academic year data.Differences between pupil groups can be meaningless when analysed at school level, particularly when the groups are
relatesmall.tosmallcohorts.This section may contain up to 3 tables of measures, depending on the school phase. The ‘Primary’ and/or ‘Secondary’ tables display the performance of pupil groups at the corresponding phase of education. Measures are generated for the pupil groups FSM6
FSMand/orM(CLA)and low/middle/high prior attainers. The ‘Absence’ table displays if the school’sschoolabsence percentage is in the highest or lowest 20% of pupils eligible for FSM, pupils with SENSENDand pupils whowithspeak English as an additional language. Only the latest year’s data is assessed in this section. Cohorts of less than 11 arewillnotbeFor the tables of performance measures, shaded boxes and text will appear for a pupil group measure (such as the Progress 8 average for low prior attainers) where the following 2 conditions are both met:
-
The pupil group measure is
showssignificantlyadifferentsignificantfromdifferenceto -
The national comparison for the pupil group measure is
differsdifferenttofromthatof
For example, if Progress 8 for all pupils is
wasnot significantly different fromtothe national figure but Progress 8 for low prior attainers iswassignificantly above thenational,national figure, the low attainers group will be highlighted. If Progress 8 for all pupils and Progress 8 for low prior attainers arewereboth significantly above thenational,national figure, then the group will not be highlighted. All possible combinations of national comparisons for a pupil group measure and national comparisons for the whole school are illustrated in the table below, along with whether that combination will result in the measure appearing in this section.Comparison to national for whole school Comparison to national for pupil group Will the measure appear? Significantly above national Significantly above national No Significantly above national In line with national No Significantly above national Significantly below national Yes In line with national Significantly above national Yes In line with national In line with national No In line with national Significantly below national Yes Significantly below national Significantly above national Yes Significantly below national In line with national No Significantly below national Significantly below national No The text and shading are based on significance when compared with the corresponding national value for each measure, except for the FSM and/or CLA pupil group,
groupwhich is compared with the national figure for pupils who are not FSM and/or CLA.Primary
Prior
Wenolongerincludeprior1areinnotthisavailablesectionthisofyear,theasIDSRkeyduestageto2lackpupilsofdidpriornotattainmenthavedata.Forkey stage 12,assessmentspriordueattainmenttogroupstheareCOVID-19basedpandemic.onThisoverallmeanskeythestageonly1grouppriorthatattainment,couldwhichbeisdisplayedcalculatedinusingthisansectionaverageisofFSM6theand/orEnglishCLA.andmathematicscomponents.Pupil group
groupsmeasures are based on the expected standard and do not appear for the high standard.It was not possible to flag group measures for phonics attainment; this is due to the spread of the data.
It was not possible to flag group measures for attainment in MTC; this is because we do not receive details of pupil prior attainment or characteristics in the MTC results data.
Secondary
Prior attainment groups are based on overall key stage 2 prior attainment, which is calculated using reading and mathematics.
Absence
Absence measures are generated for pupils eligible for FSM, pupils with SEN
SENDand pupils whowithspeak English as an additional language.languageThey(EAL)and2022/23(3-termthe latest academic year.absence).For the ‘Absence’ table, the shading and text generally follow the same rules as for the tables of performance measures, except that,
thatfor absence,absencethe text and shading are based on quintile (highest/lowest 20%). For example, if the school’sschoolpercentage of persistent absentees for all pupils iswasnot in the highest 20% nationally, but the school percentage of persistent absentees for pupils with SENSENDiswasin the highest 20% nationally, the SENSENDpupil group will be highlighted. If the school’sschoolpercentage of persistent absentees for all pupils and for pupils with SENSENDarewereboth in the highest 20% nationally, then the group will not be highlighted.Further notes
Note that:
-
because
duetosmallcohortsofgroups,are small, it is much less likely thatforthese measures willtoappear -
pupil group measures for suspensions and exclusions will not be shown
-
pupil group measures for performance for 16 to 18 will not be shown – it was not possible to calculate pupil group measures for 16 to 18 in 2023, because no value-added or completion and attainment data was available because
asaresultCOVID-19.
Understanding the data in the IDSR
Statistical significance
Assessment data and information are starting points for inspectors’ discussion with schools. We
Statisticaluse statistical significance testingisusedintheIDSRFor progress measures, the DfE provides Ofsted with the 95% confidence intervals, enabling us
thetostatisticalcalculatesignificancethetostatisticalbesignificance.calculated.The DfE publishes guidance about the Progress 8 data and confidence intervals.There can be slight differences between
‘Compare schoolSchooland collegeCollegeperformancePerformancein England’and the IDSR, including for Progress 8,8because of different rounding methodology. For ‘Compare school and college performance,’performance’the bandings are calculated fromonrounded data and this is an established convention inwithinthe performance tables. They base their bandings, and whether they consider a school’s score to be above or below average (significantly different from 0), on the published value of the confidence interval at 2 decimal places. For example, they do not treat a school with an upper confidence limit of -0.00234, which is rounded up and shown as 0.00, as significantly below average. The IDSR, however, uses unrounded values and will,willfor example, show a school with an upper confidence limit of -0.00234 as significantly below average.below.Statistical significance calculations use cohort size, or number of pupils, in the calculation. Therefore, a large cohort is much more likely to show a statistically significant difference from
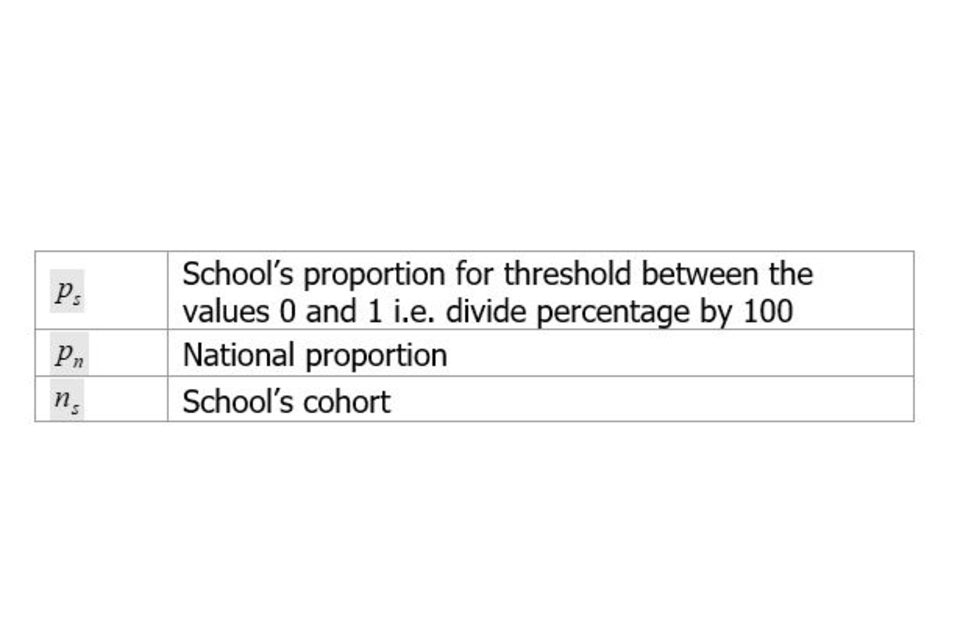
tonational averages than a small cohort.Significance calculation for threshold measures
We
Ause a normal approximation to the binomial distributionisusedBefore applying the test, we check that:
nP
and
n(1-P)
are greater than or equal to 5.
When:
-
P represents the national average of pupils reaching the expected standard
-
n represents the total number of pupils
The calculation is as follows:
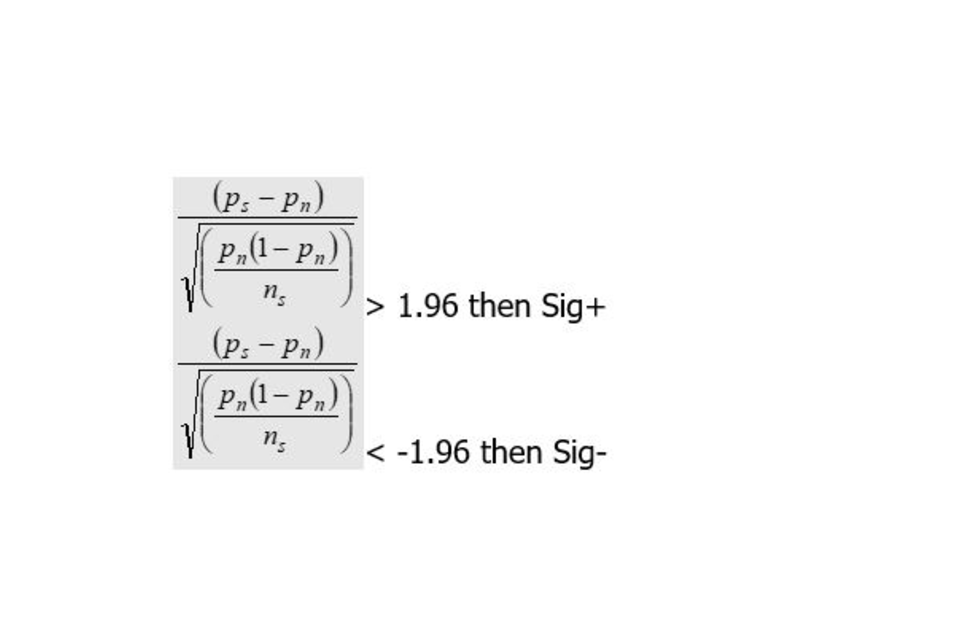
Otherwise not statistically significant.
When:
We
Thisapplymethodologythisismethodologyappliedto the following performance measures:-
key stage 2 expected standard and high standard/greater depth thresholds
-
keystage1expectedstandardandgreaterdepththresholds Year 1 phonics
-
destinations
Year-on-year
One-yearand4-yearSchool A’s data for the last 2 years is shown below:
Data year % expected standard National % expected standard National standard deviation Difference from national Difference in standard deviation Previous year 202254% 75% 20% -21 percentage points -1 Latest year 202396% 75% 20% +21 percentage points +1 When we compare the difference in standard deviation from one
2022year to the2023,next, the school has moved up by 2 standard deviations (from -1 to +1);+1),therefore,thereforethe IDSR will show a dark upward arrow.Absence and exclusions
The
Absencefirstdatareleaseisofusuallythe IDSR in eachallacademicIDSRsyearbyincludesDecemberabsenceeachdata.year.This willisbebecausein the form of 1 term data beforeisbeingonlyupdatedprovidedwithto2Ofstedtermafterand then 3 term later in the academicprimaryyear.IDSRrelease.The permanent exclusions and suspensions data is 1 year behind. For example, 2022/23
2017/18exclusions data was published in 2024.July2019.1shown on the context page and the number on roll may have changed.For absence and suspensions, special schools are compared with the national value for secondary schools. For permanent exclusions, special schools are compared with the national value
averagefor special schools.DatasourcesAlldataintheIDSRisfromtheDfE.Weusethedatatocalculateschool-,local-authority-andnational-leveldata.Pupil-leveldataisanonymousanddoesnotcontainnamesoraddresses.Itisnotsharedwithinspectorsatanypoint.WereceivethefollowingdatasetsfromtheDfEtoproducetheIDSR.Nationalpupildatabase:keystage1andphonicsschoolcensustopopulatecontextualsectionsASPallkeystages
Performancetables:schoolandcollegedatabase(SCDB)primaryandsecondarykeystage2keystage416to18level3valueadded
Absenceandexclusionsdata:school-levelexclusions2-termabsence3-termabsence
YoucanfindmoreinformationontheaccountabilitymeasuresintheseDfEguidancedocuments:secondaryaccountabilitymeasures(includingProgress8andAttainment8)
Special schools and pupils with SEN
SENDAn IDSR is produced for special schools. However, it may contain very little information about the performance of pupils.
Pupils with SEN
SENDare a diverse group with differing needs and expectations. Therefore, the IDSR will no longer display any averages for this group.The
ContextualIDSRinformationprovidesiscontextualprovidedinformation for the group, including the breakdown of the number of pupils with SENSENDby primary special educational need.Junior and middle schools
A standard sentence explains
appearstoexplainInspectors should be aware of this and, as with any inspection, carefully consider a range of information and data.
Missing data
There are a few possible reasons why data for some years is not shown for a particular measure.
In charts and tables, data may not be shown for some years because:
-
the measure did not exist, was defined differently or was not available to Ofsted for that year; if this is the case, the data is shown as a dash
-
the school had no pupils for a particular measure in that year; if this is the case, the cohort will be shown as a 0 and a dash will be shown for the measure
-
if the school recently changed legal status, for example from a local authority maintained school to a sponsor-led academy, the data may be shown under the predecessor school name or unique reference number (URN) in ASP
National figures
The national figures may differ from the figures published in the DfE’s performance tables and ASP. This is due to the varying decimal precisions used between organisations.
The FSM6
FSMand/or CLA pupil group is compared with the national figure for pupils who are not FSM6FSMand/or CLA.Prior attainment pupil groups are compared with their respective pupil group nationally.
Service children’s education providers have been assigned a phase based on the ages of pupils in the school.
Cohorts and numbers of pupils included
Cohorts display the total number of pupils based on the group and year of the measure presented.
For measures when all pupils were entered, the cohort shows the number of pupils the measure is based on. For some measures, it is used as the denominator for percentages.
If there have been any leavers and joiners, then the cohort number shown on progress and attainment data may not match the context section. The context section is a snapshot of the day the school census is taken in January of that year.
The ‘number of pupils included’ on progress pages only includes pupils with prior attainment information.
16 to 18 cohorts
The
Therearedifferentrulesthatisbased on the census data,dataso there may be students whothatare no longer on roll but still allocated to the provider for accountability purposes.For the destinations, the DfE uses a flexible end year to determine which students are included in the measure. There are more details in the accountability guide.
Conditions of use
The IDSR conditions of use and storage are that:
-
the IDSR is to be used only for educational and analytical purposes and for informing inspection, not for any other purpose
-
data presented in the IDSR is to be shared only with those who need it and are authorised to have access to it
theinformation -
only nominated users may access the IDSR, and these users must be made aware that they cannot share the IDSR without permission from the data owner
-
the IDSR should be saved in a secure location with limited access
16to18studentgroupsPriorattainmentstudentgroupsareshownforsomemeasures.Thesegroupsarebasedonstudents’averagepointsscoreatkeystage4,whichiscalculatedbygivingapointscoretoeachgradeandtakinganaverageacrossallthestudent’sgrades.TheDfE’ssecondaryaccountabilitymeasuresguidancecontainsfurtherdetailsonhowthesescoresarecalculated.IntheIDSR,weusegroupsofscores.Forlevel3students,theseareasfollows:studentswithpriorattainmentgrades7–9(equivalenttogradesA*–Aundertheoldgradingstructure)studentswithpriorattainmentgrades4–6(equivalenttogradesB–Cundertheoldgradingstructure)studentswithpriorattainmentgrades3andunder(equivalenttogradesD–Gundertheoldgradingstructure)
ComparisontonationalforwholeschoolComparisontonationalforpupilgroupWillthemeasureappear?SignificantlyabovenationalSignificantlyabovenationalNoInlinewithnationalNoSignificantlybelownationalYesInlinewithnationalSignificantlyabovenationalYesInlinewithnationalNoSignificantlybelownationalYesSignificantlybelownationalSignificantlyabovenationalYesInlinewithnationalNoSignificantlybelownationalNoToalignstudents’averagepointsscorestothesegroups,wecalculateanupperboundandlowerboundforeachgroup.Tocalculatetheupperboundforeachgroup,wecalculatethemidpointbetweenthemaximumpointsscorewithinthegroupandtheminimumpointsscorewithinthenexthighestgroup.Forexample,tocalculatetheupperboundforthe4–6group,wetakethemidpointbetweenthemaximumpointsscoreforthe4–6group(5.5)andtheminimumpointsscoreforthe7–9group(7):Upperbound=(5.5+7)/2=6.25Similarly,tocalculatethelowerboundforeachgroup,wecalculatethemidpointbetweentheminimumpointsscoreforthegroupandthemaximumpointsscoreforthenextlowestgroup.Forexample,tocalculatethelowerboundforthe4–6group,wetakethemidpointbetweentheminimumpointsscoreforthe4–6group(4)andthemaximumpointsscoreforthe3andundergroup(3):Upperbound=(3+4)/2=3.5Thesecalculationsproducethefollowingaveragepointsscoreboundaries.GCSEgradegroupAveragepointsscoreboundaries7–96.25andabove4–63.5–6.253andunder0–3.5Forlevel2students,wefollowanequivalentprocesstocalculateaveragepointsscoreboundariesforthefollowinggroups.GCSEgradegroupAveragepointsscoreboundaries3-92.5andabove21.25–2.51andunder0–1.25ForvalueaddeddatarelatingtoAlevel,ASlevelandappliedgeneralqualifications,andcompletionandattainmentdatarelatingtotechlevelqualifications,thefollowinggroupsbasedonpriorattainmentforlevel3studentsareshown:studentswithpriorattainmentgrades7–9(averagepointsscoreof6.25orhigher)studentswithpriorattainmentgrades4–6(averagepointsscoreof3.5oraboveupto,butnotincluding,6.25)studentswithpriorattainmentof3andunderGCSEpointscore(averagepointsscorebelow3.5)
Forcompletionandattainmentdatarelatingtotechnicalcertificatequalifications,FSMand/orCLAstudentsandthefollowinggroupsbasedonpriorattainmentforlevel2studentsareshown:studentswithpriorattainmentgrades3–9(averagepointsscoreof2.5orhigher)studentswithpriorattainmentgrade2(averagepointsscoreof1.25oraboveupto,butnotincluding,2.5)studentswithpriorattainmentgrade1andunder(averagepointsscorebelow1.25)
Ifperformancedoesnotdifferfromthatoftheprovider,nosentenceswillappear.Data protection
When accessing the data in the Ofsted IDSR service, you must recognise the privacy of that data and always comply with the Data Protection Act 2018. The Data Protection Act 2018 is the UK’s implementation of the General Data Protection Regulation (GDPR). You must ensure that you use the data that you have access to for the purpose for which the service was set up and that you do not use the data for any other purpose. You must ensure that the data is processed securely and that it is not subject to any unauthorised use or disclosure.
-
Updates to this page
Last updated 10
-
We have released the 2024 primary IDSR with IDSR developments for all schools, as highlighted in our September newsletter. The guidance now reflects all new data updates. The main data updates are the latest 2024 key stage 2, phonics, contextual data, 1-term absence, final exclusions for 2023 and new alternative provision placements data.
-
We have updated the IDSR for all schools with final (key stages 2, 4 and 16 to 18) 2023 data as well as 3-term absence. The guidance has been updated to reflect these changes.
-
We have updated the IDSR for all secondary schools with revised 2023 key stage 4 and 16 to 18 data. The guidance has been updated to reflect these changes.
-
We have updated the IDSR for all schools including schools with a sixth form with the latest pupil movement data for 2022/23 and revised key stage 2 data. We have updated the IDSR for all schools including schools with a sixth form, with the latest pupil movement data for 2022/23, and revised key stage 2 data. The guidance has been updated to reflect these changes.
-
We have updated the IDSR for all schools including schools with a sixth form with the latest absence data for 2022/23 (autumn and spring terms), final key stage 1 and final multiplication tables data. The guidance has been updated to reflect these changes.
-
We have updated the IDSR for secondary schools and schools with a sixth form, with the latest provisional 2023 key stage 4 and 16 to 18 data. The guidance has also been updated to reflect these changes.
-
We have released the 2023 primary IDSR with IDSR developments for all schools, as highlighted in our last newsletter. The main data updates are latest 2023 key stage 2, key stage 1, phonics, contextual data and 2021/22 suspensions and permanent exclusions.
-
We have updated the inspection data summary report (IDSR) for all schools. The main changes includes the 16 to 18 final 2022 data, including the updated retention measure. We also updated the trust/local authority level information section to include the most recent inspection outcome (graded or ungraded) based on latest URN for trusts only.
-
We have updated the inspection data summary report (IDSR) for all schools. The following data has been updated: Key stage 4 - final, Key stage 2 – final (including the multiplication tables check) and absence data – 3 terms.
-
Updated the secondary inspection data summary report (IDSR). The main changes are revisions to key stage 4, 16-18 data, pupil movement between 2021 and 2022 and destinations data. Also included are changes to the way we calculate key stage 4 subject entries.
-
Updated the primary inspection data summary report (IDSR). The main changes are revised key stage 2, final key stage 1 and final phonics data. Also included are minor changes to the pupil movement section of the secondary school IDSR.
-
Updated with absence data.
-
Ofsted has released the 2022 secondary IDSR and the guidance has been updated to reflect this. The main changes include the release of 2022 key stage 4 attainment and progress data, key stage 5 attainment and developments to the pupil movement section.
-
Ofsted has released the 2022 primary IDSR and the guidance has been updated to reflect this. The main changes are latest 2022 key stage 2, key stage 1, phonics, contextual data and 2020/21 suspensions and permanent exclusions. Also included are updates on the new functionality to remove sentences highlighted in grey.
-
Guidance updated to reflect that EYFS profile data is no longer included in the inspection data summary report (IDSR).
-
Updated with absence and finance data.
-
The guidance has been updated to reflect the new web-based IDSR format, new data received since their last release and the integration of school sixth form guidance.
-
Guidance updated in response to user queries, including information on what ‘not authorised’ means, clarification on average number of qualifications for 2021 and further details about the stability measure.
-
Ofsted have released a November 2021 IDSR and the guidance has been updated to reflect this. The main changes are latest 2021 contextual data, a new section for 2021 subject entries and new terminology for suspensions. Supporting tables spreadsheet updated: 2021 prior attainment national averages, autumn 2020 absence bounds, suspensions bounds have been updated or added to for 2021. No performance bounds have been updated. Sentence master list updated to reflect minor improvements/changes/combinations to current area of interest sentences and incorporating 2020 and 2021 figures where applicable.
-
New section of guidance added for the release of autumn 2020 absence data. This data is based on the DfE census collection and has been provided as a new section within the IDSR.
-
Added two spreadsheets: sentence master list and supporting data tables.
-
Guidance amended to reflect the latest version of the IDSR, including example reports.
-
Updated guidance to incorporate the addition of 'service children education providers' and the supporting tables have been updated to reflect the release of revised key stage 4 data.
-
Updated to include final 2019 EYFS, supporting tables updated with revised KS2, data for disadvantaged pupils and final 2019 EYFS and a new master list of all 2019 areas of interest sentences.
-
Updated the guidance to enhance users understanding of the ‘grey’ area of interest sentences and added more direct links for ease of use.
-
Updated supporting data tables to include key stage 1 attainment of the expected standard by Early Years Foundation Stage prior outcome.
-
Updates the 'English Baccalaureate entry' section.
-
Updated guide and data tables following further releases of data.
-
Added IDSR guidance for secondary schools.
-
Added a link to the DfE Sign-in for users to log into Analyse School Performance to view and download their schools' IDSR. Also added an example secondary school IDSR.
-
Added 2019 supporting data tables.
-
Added an example inspection data summary report.
-
First published.
Update history
2026-07-10 09:21
We have updated the IDSR for all schools with the DfE’s 2025/26 daily attendance collection up to and including summer part 1. The IDSR guidance has been updated to reflect this latest update.
2026-06-05 09:46
We have updated the IDSR for all schools with the DfE’s 2025/26 daily attendance collection up to and including spring part 2. The IDSR guidance has been updated to reflect this latest update.
2026-05-15 10:11
We have updated the IDSR for all schools with spring 2024/25 suspensions and permanent exclusions data. The IDSR guidance has been updated to reflect this latest update.
2026-04-24 09:58
We have updated the IDSR for all schools with the latest and final data. The IDSR guidance has been amended to reflect these latest updates.
2026-03-27 09:37
We have updated the IDSR for all schools with the DfE’s 2025/26 daily attendance collection up to and including spring part 1. The IDSR guidance has been updated to reflect this.
2026-03-13 10:18
We have updated the IDSR for all schools with latest pupil movement data, introduced new format summary tables and updated the methodology underpinning the gap trend. The IDSR guidance has been updated to reflect these changes.
2026-03-02 09:53
The guidance has been updated to reflect that we have updated the IDSR for all schools with new daily attendance data.
2026-02-13 10:23
We have updated the IDSR for all schools with the latest available data including revised 16 to 18 performance data. The IDSR guidance has been updated to reflect these updates.
2026-02-06 11:02
We have updated the IDSR for all applicable schools with revised key stage 4 data. The IDSR guidance has been updated to reflect these updates.
2026-01-23 10:34
We have updated IDSRs with 2024/25 autumn term exclusions data. The IDSR guidance has been updated to reflect this change.
2025-12-05 12:10
We have updated the IDSR for all applicable schools with 2025 revised key stage 2, provisional 16 to 18, final phonics, 2 term absence and final multiplication tables check data. The IDSR guidance has been updated to reflect these updates.
2025-11-21 09:54
We have updated the IDSR for all schools with provisional 2025 key stage 4 data. The IDSR guidance has been updated to reflect this change.
2025-11-04 10:28
We have released the 2025 provisional primary IDSR, with several developments for the renewed inspection framework, for all schools. The IDSR guidance now reflects all new developments and data updates. The main data updates are the latest 2025 key stage 2, phonics, contextual data, 1-term absence, final exclusions for 2024 and new alternative provision placements data.
2025-05-01 10:54
We have updated the IDSR for all applicable schools with final key stage 2, key stage 4 and 16 to 18 data. We have also updated absence data with the final 3-term data. The IDSR guidance has been updated to reflect this change.
2025-03-06 11:19
We have updated the IDSR for all secondary schools with revised 2024 key stage 4 and level 3 value-added data. The IDSR guidance has been updated to reflect this update.
2025-02-06 11:48
We have updated the IDSR for all schools with revised 2024 key stage 2 and 16 to 18 performance data. The IDSR guidance has been updated to reflect this change.
2025-01-16 14:09
Updated the IDSR for all secondary schools with provisional 2024 key stage 4 data. The IDSR guidance has been updated to reflect this change.
2024-12-12 10:17
Updated the IDSR guidance for all schools with 2-term (autumn & spring) absence data for 2023/24, provisional destinations data for 2022/23, final phonics data for 2024, and multiplication tables check (MTC) data for 2024.
2024-10-10 11:16
We have released the 2024 primary IDSR with IDSR developments for all schools, as highlighted in our September newsletter. The guidance now reflects all new data updates. The main data updates are the latest 2024 key stage 2, phonics, contextual data, 1-term absence, final exclusions for 2023 and new alternative provision placements data.
2024-05-02 09:30
We have updated the IDSR for all schools with final (key stages 2, 4 and 16 to 18) 2023 data as well as 3-term absence. The guidance has been updated to reflect these changes.
2024-03-06 09:30
We have updated the IDSR for all secondary schools with revised 2023 key stage 4 and 16 to 18 data. The guidance has been updated to reflect these changes.
2024-02-07 09:30
We have updated the IDSR for all schools including schools with a sixth form with the latest pupil movement data for 2022/23 and revised key stage 2 data. We have updated the IDSR for all schools including schools with a sixth form, with the latest pupil movement data for 2022/23, and revised key stage 2 data. The guidance has been updated to reflect these changes.
2023-12-13 10:21
We have updated the IDSR for all schools including schools with a sixth form with the latest absence data for 2022/23 (autumn and spring terms), final key stage 1 and final multiplication tables data. The guidance has been updated to reflect these changes.
2023-11-15 09:37
We have updated the IDSR for secondary schools and schools with a sixth form, with the latest provisional 2023 key stage 4 and 16 to 18 data. The guidance has also been updated to reflect these changes.
2023-10-18 10:16
We have released the 2023 primary IDSR with IDSR developments for all schools, as highlighted in our last newsletter. The main data updates are latest 2023 key stage 2, key stage 1, phonics, contextual data and 2021/22 suspensions and permanent exclusions.
2023-06-07 09:30
We have updated the inspection data summary report (IDSR) for all schools. The main changes includes the 16 to 18 final 2022 data, including the updated retention measure. We also updated the trust/local authority level information section to include the most recent inspection outcome (graded or ungraded) based on latest URN for trusts only.
2023-05-04 09:30
We have updated the inspection data summary report (IDSR) for all schools.The following data has been updated: Key stage 4 – final, Key stage 2 – final (including the multiplication tables check) and absence data – 3 terms.
2023-03-22 09:30
Updated the secondary inspection data summary report (IDSR). The main changes are revisions to key stage 4, 16-18 data, pupil movement between 2021 and 2022 and destinations data. Also included are changes to the way we calculate key stage 4 subject entries.
2023-02-14 09:30
Updated the primary inspection data summary report (IDSR). The main changes are revised key stage 2, final key stage 1 and final phonics data. Also included are minor changes to the pupil movement section of the secondary school IDSR.
2022-12-15 09:30
Updated with absence data.
2022-11-17 10:54
Ofsted has released the 2022 secondary IDSR and the guidance has been updated to reflect this. The main changes include the release of 2022 key stage 4 attainment and progress data, key stage 5 attainment and developments to the pupil movement section.
2022-10-20 09:30
Ofsted has released the 2022 primary IDSR and the guidance has been updated to reflect this. The main changes are latest 2022 key stage 2, key stage 1, phonics, contextual data and 2020/21 suspensions and permanent exclusions. Also included are updates on the new functionality to remove sentences highlighted in grey.
2022-06-07 09:21
Guidance updated to reflect that EYFS profile data is no longer included in the inspection data summary report (IDSR).
2022-05-19 09:30
Updated with absence and finance data.
2022-02-28 14:00
The guidance has been updated to reflect the new web-based IDSR format, new data received since their last release and the integration of school sixth form guidance.